from IPython.display import Image# @hidden_cell
Image("figures/00_aurora_backdrop_VbZDFnn.jpeg")
Image("figures/00a_aurora_backdrop_screenshot_with_credits.png")
Overview
Objectives, Motivation, Core Packages, Development Principles, History & Software testing
Processing Outline
TF Calculations (external notebook)
High level flow, TF Kernel Concept, Main Interfaces
Processing Detail
Code Flows
Core data structures
Example Results
Synthetic Data
Field Data
Jupyter Notebook exercises
Synthetic Data processing
Earthscope Data
Here are some notes ...
Aurora
EarthScope (IRIS) Sponsored Project
Hosted by SimPEG (Geophysical tools developed at UBC)
Objectives:
Provide Open-Source Magnetotelluric (MT) Time Series Processing in Python
Produce transfer function (TF) objects in mt_metadata format from time series archived in mth5 format.
Emulate Egbert’s EMTF legacy remote-reference FORTRAN and Matlab codes
Motivation
Allow researchers to spend more time on data analysis and interpretation, and less time worrying about:
interfaces between metadata and processing
time series wrangling
digital filtering
spectral leakage
spectrogram transformations
calibration (digital counts to SI units)
complex-valued regression, regularization, etc.
robust statistics
noise level and error bar estimation
rotations
Provide framework for:
plugging-in new methods
comparison of benchmark results with updated
simple exploration of processing configurations
Image("figures/xkcd_standards.png")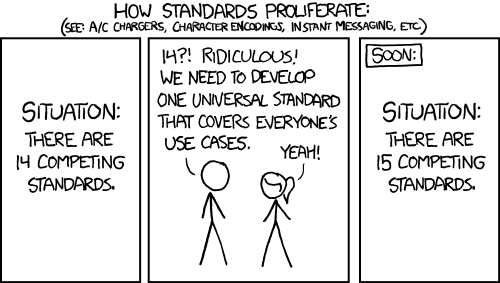
Development Principles
Open source
Leverage existing tools and frameworks
Extensibility
Reusability
Readability (PNCA)
Parallelizability*
*Work in progress
History
2021: Translate EMTF to python and work with MTH5
2022: Workflows and examples, development
2023: Wide scale testing
2024: Fourier Coefficients layer tested, features layer in development
Image("figures/01_joss_manuscript_cover.png")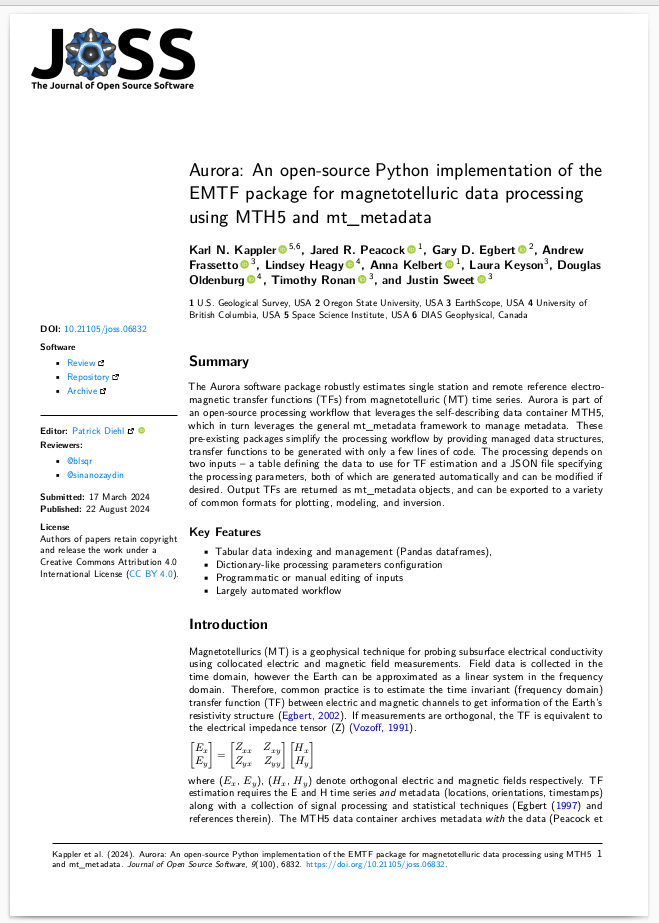
Software Testing
Relatively well tested
Uses a combination of unit-tests and integrated tests
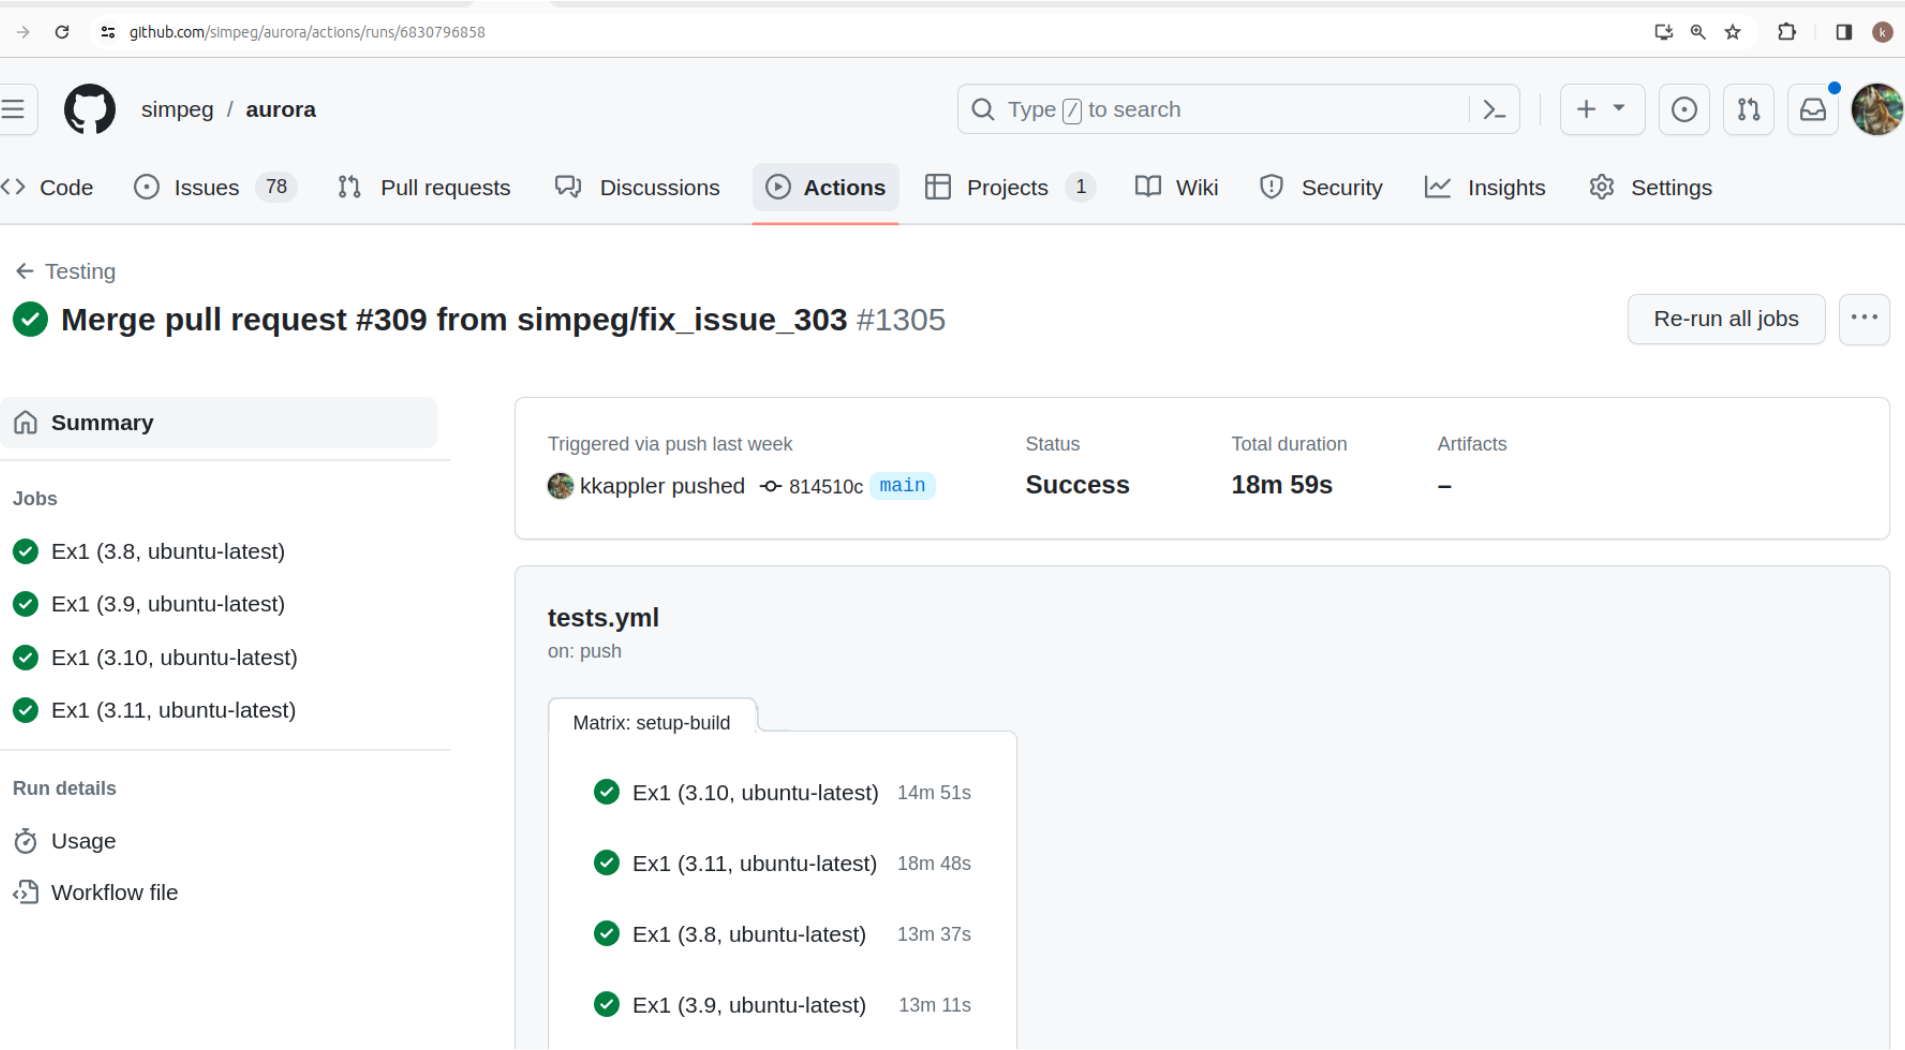
Tests rely on Real and Synthetic Data:
EMTF came packaged with synthetic data time series from two stations, and we used these data to validate aurora’s results.
Provides a benchmark
Used for rapid integrated tests
Image("figures/github_tested.png")
MT Data Processing Outline
The Transfer function equations are described in terms of processing in a companion notebook:
auxiliary/tf_calculations.ipynb
(These links may work in jupyter-lab)
Image("figures/data_processing_ecosystem.png")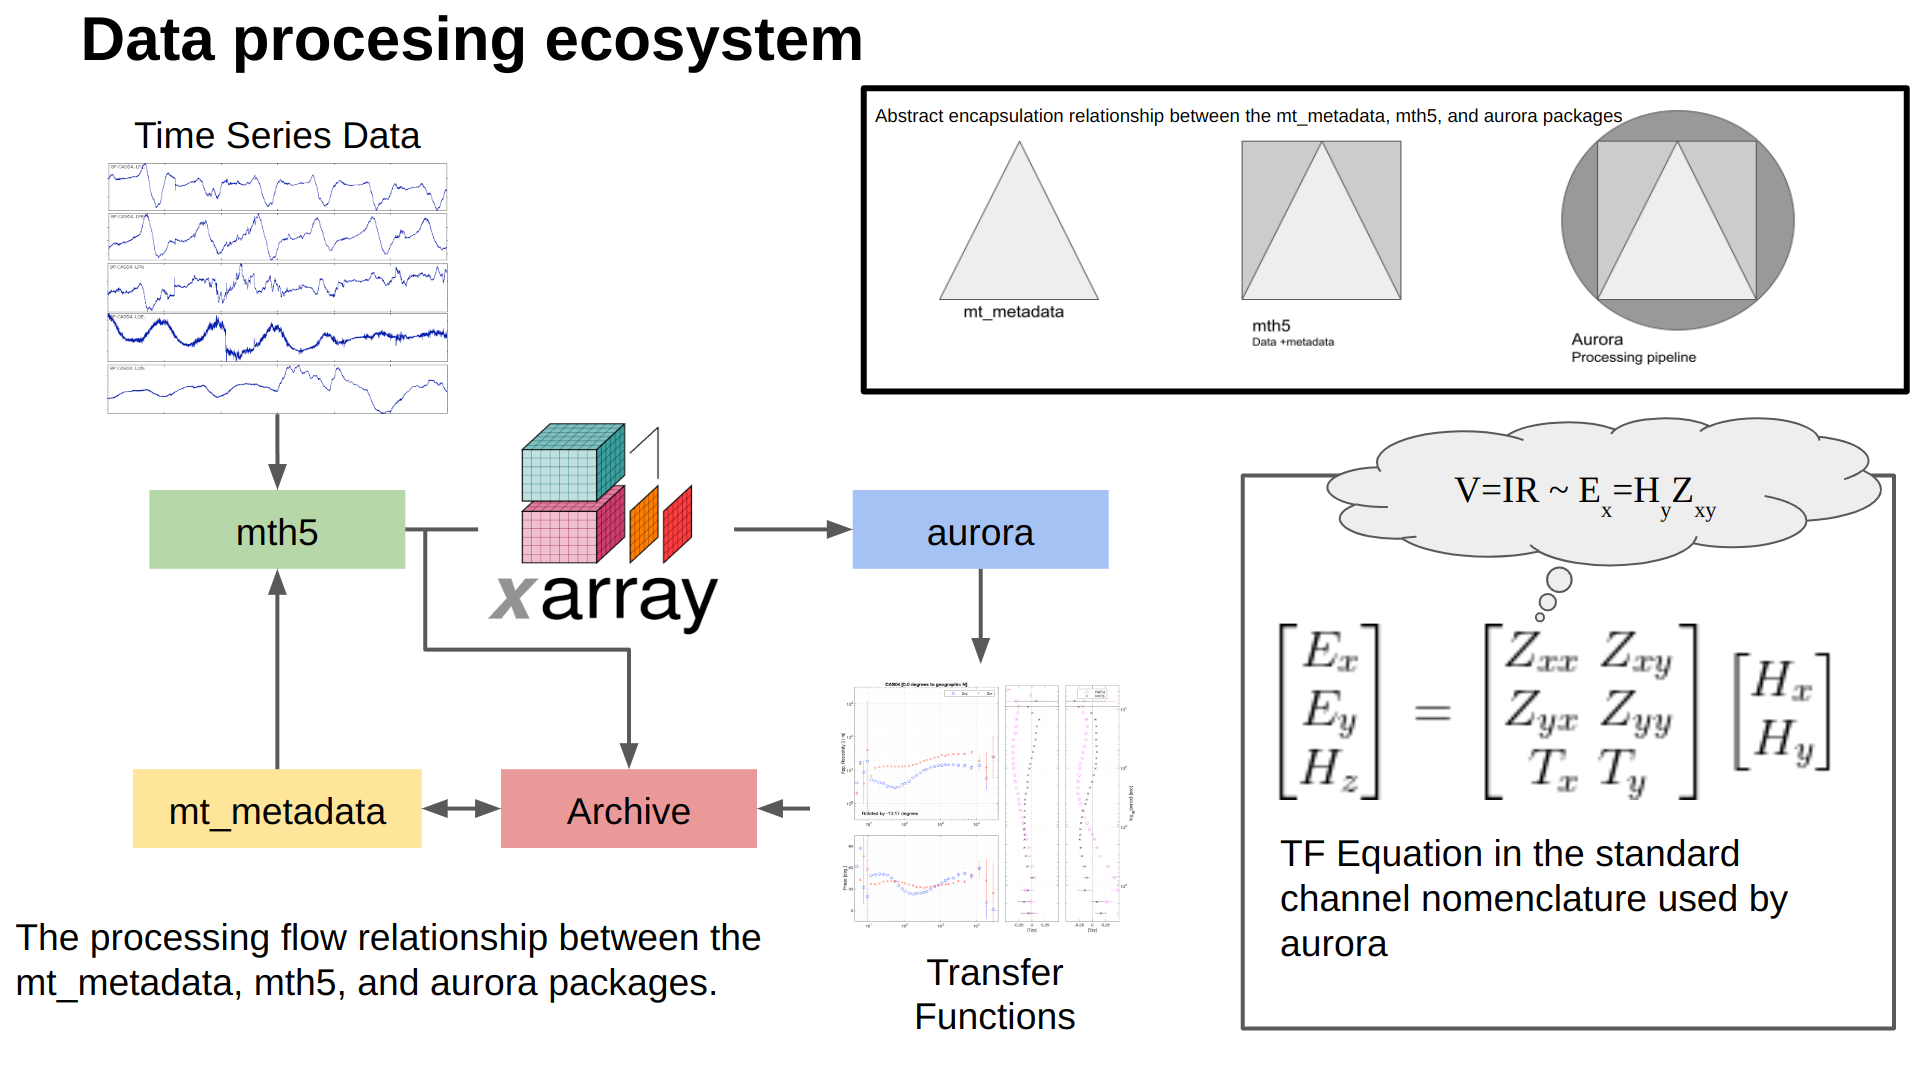
High Level Processing Flow
Image("../../../aurora/paper/aurora_workflow.png", width=3000, height=4400) # figures/00a_aurora_backdrop_screenshot_with_credits.png")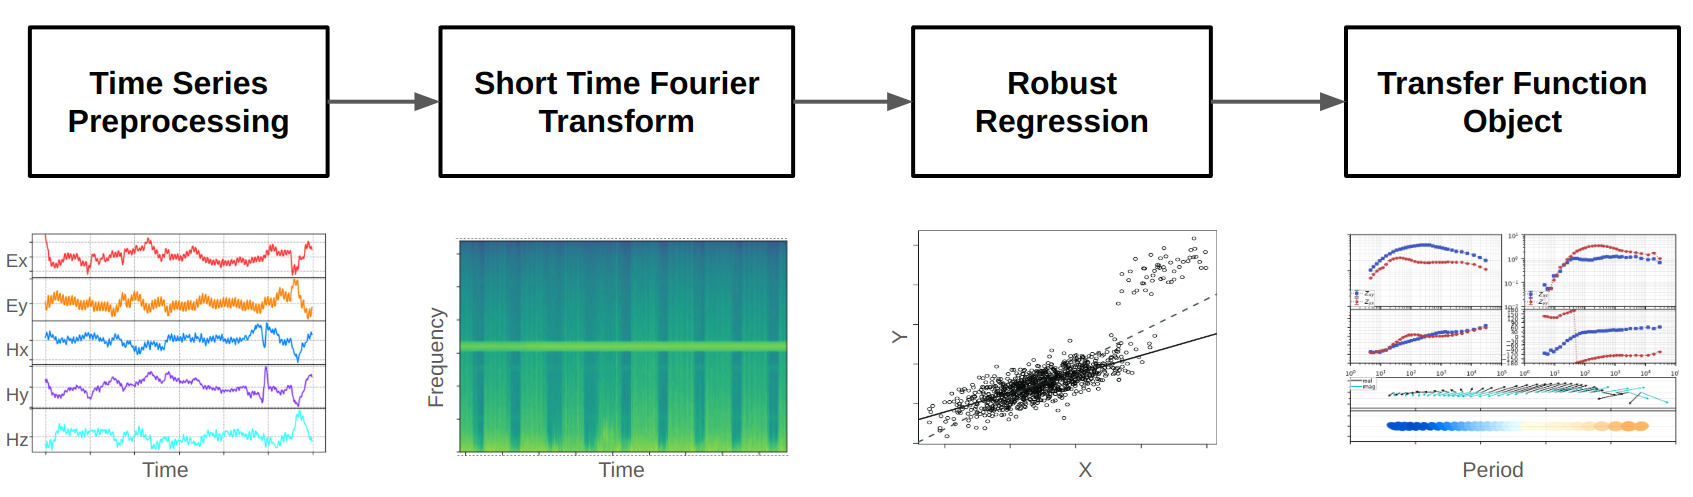
Image("figures/process_flow_high_level_paper_figure_2.png")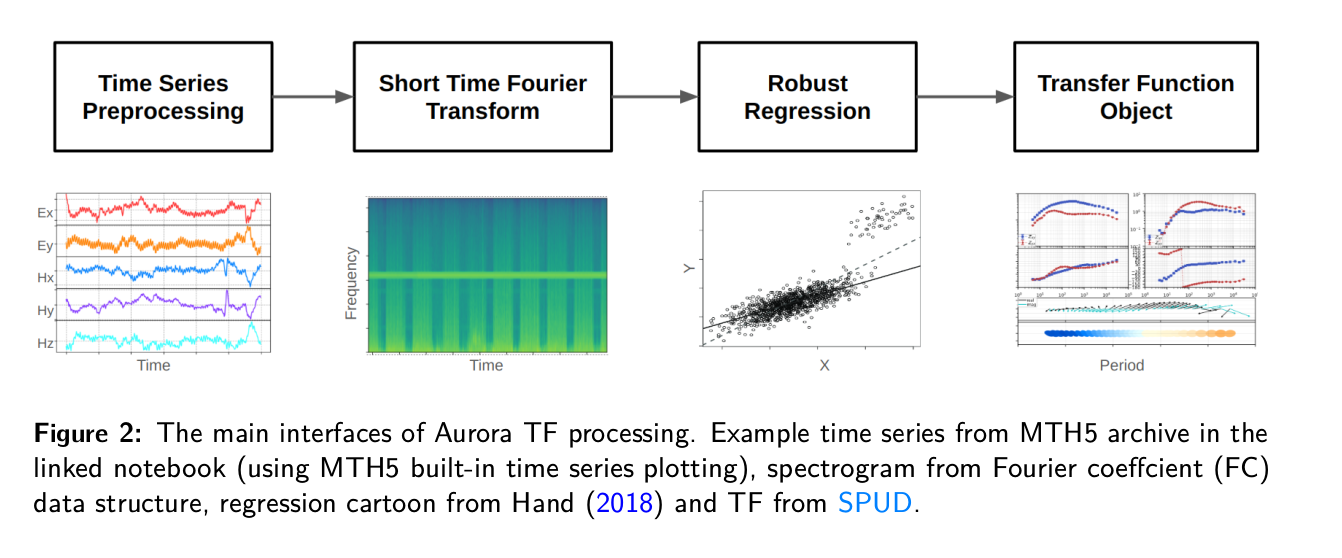
Image("figures/tf_kernel_paper_figure_1.png")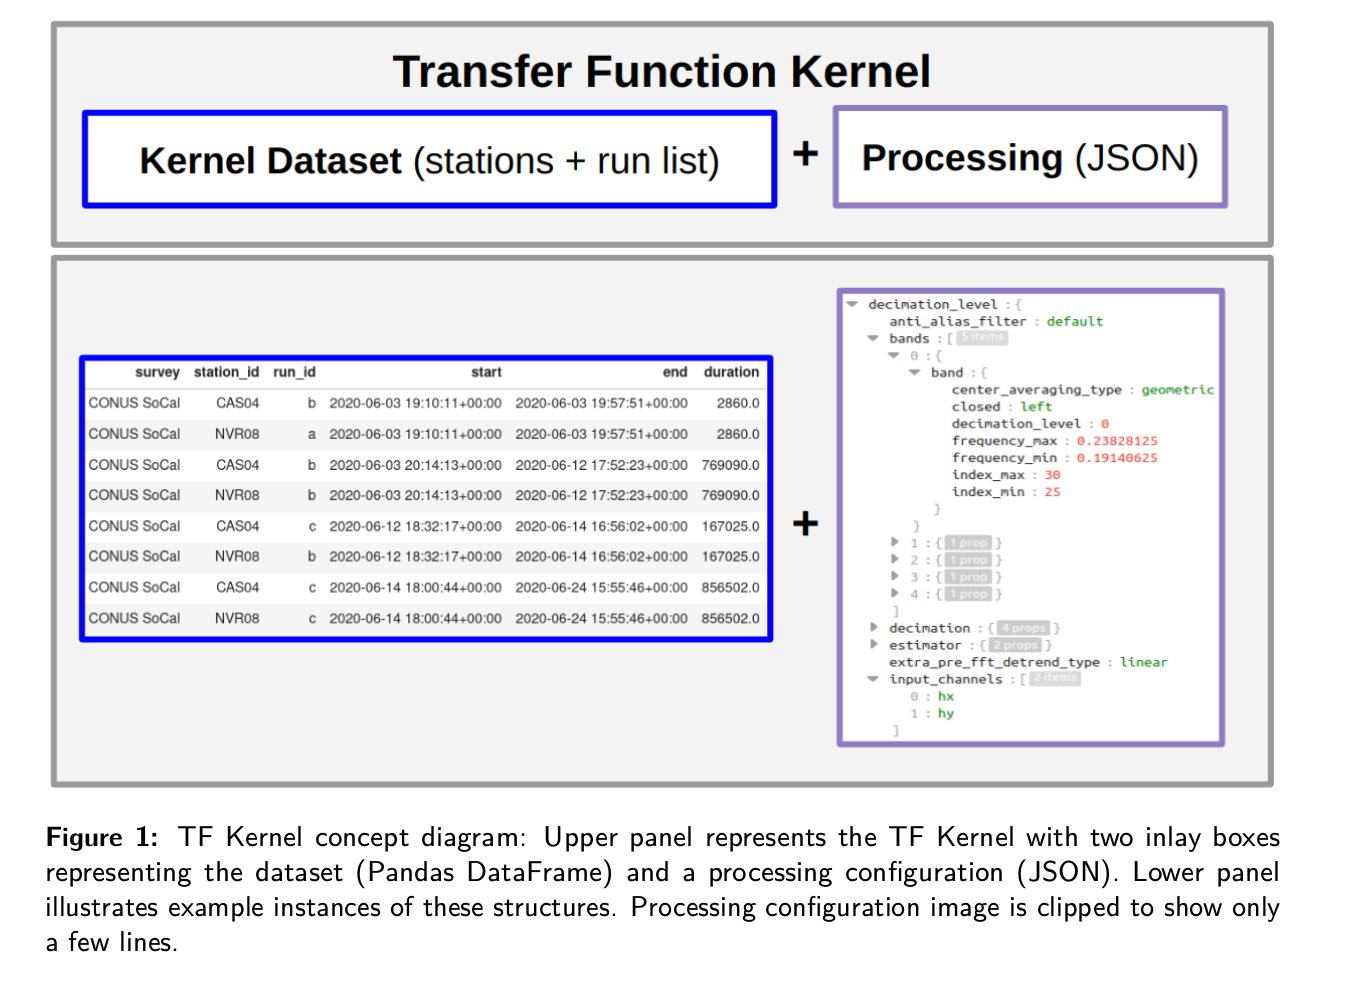
Image("figures/process_flow_main_interfaces.png")
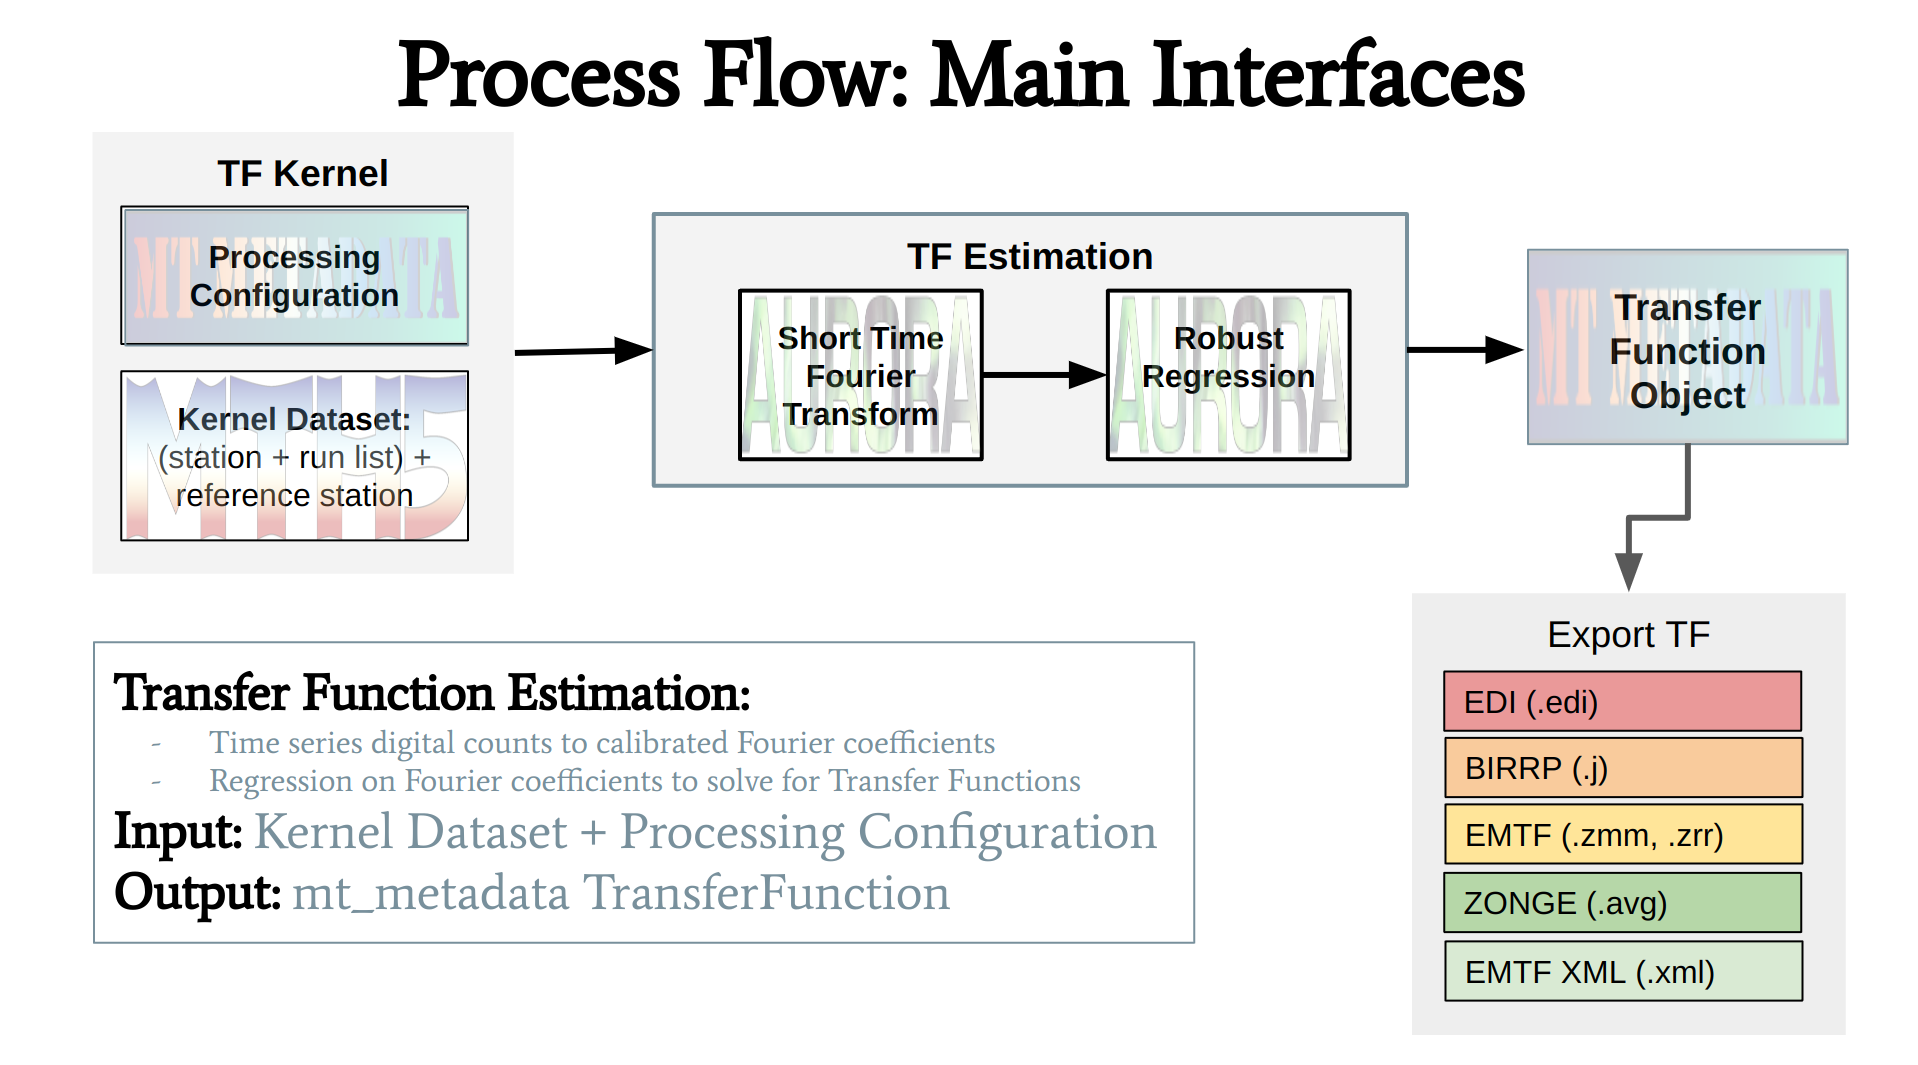
Detailed Processing Flow
Image("figures/detailed_flow_1_of_2.png")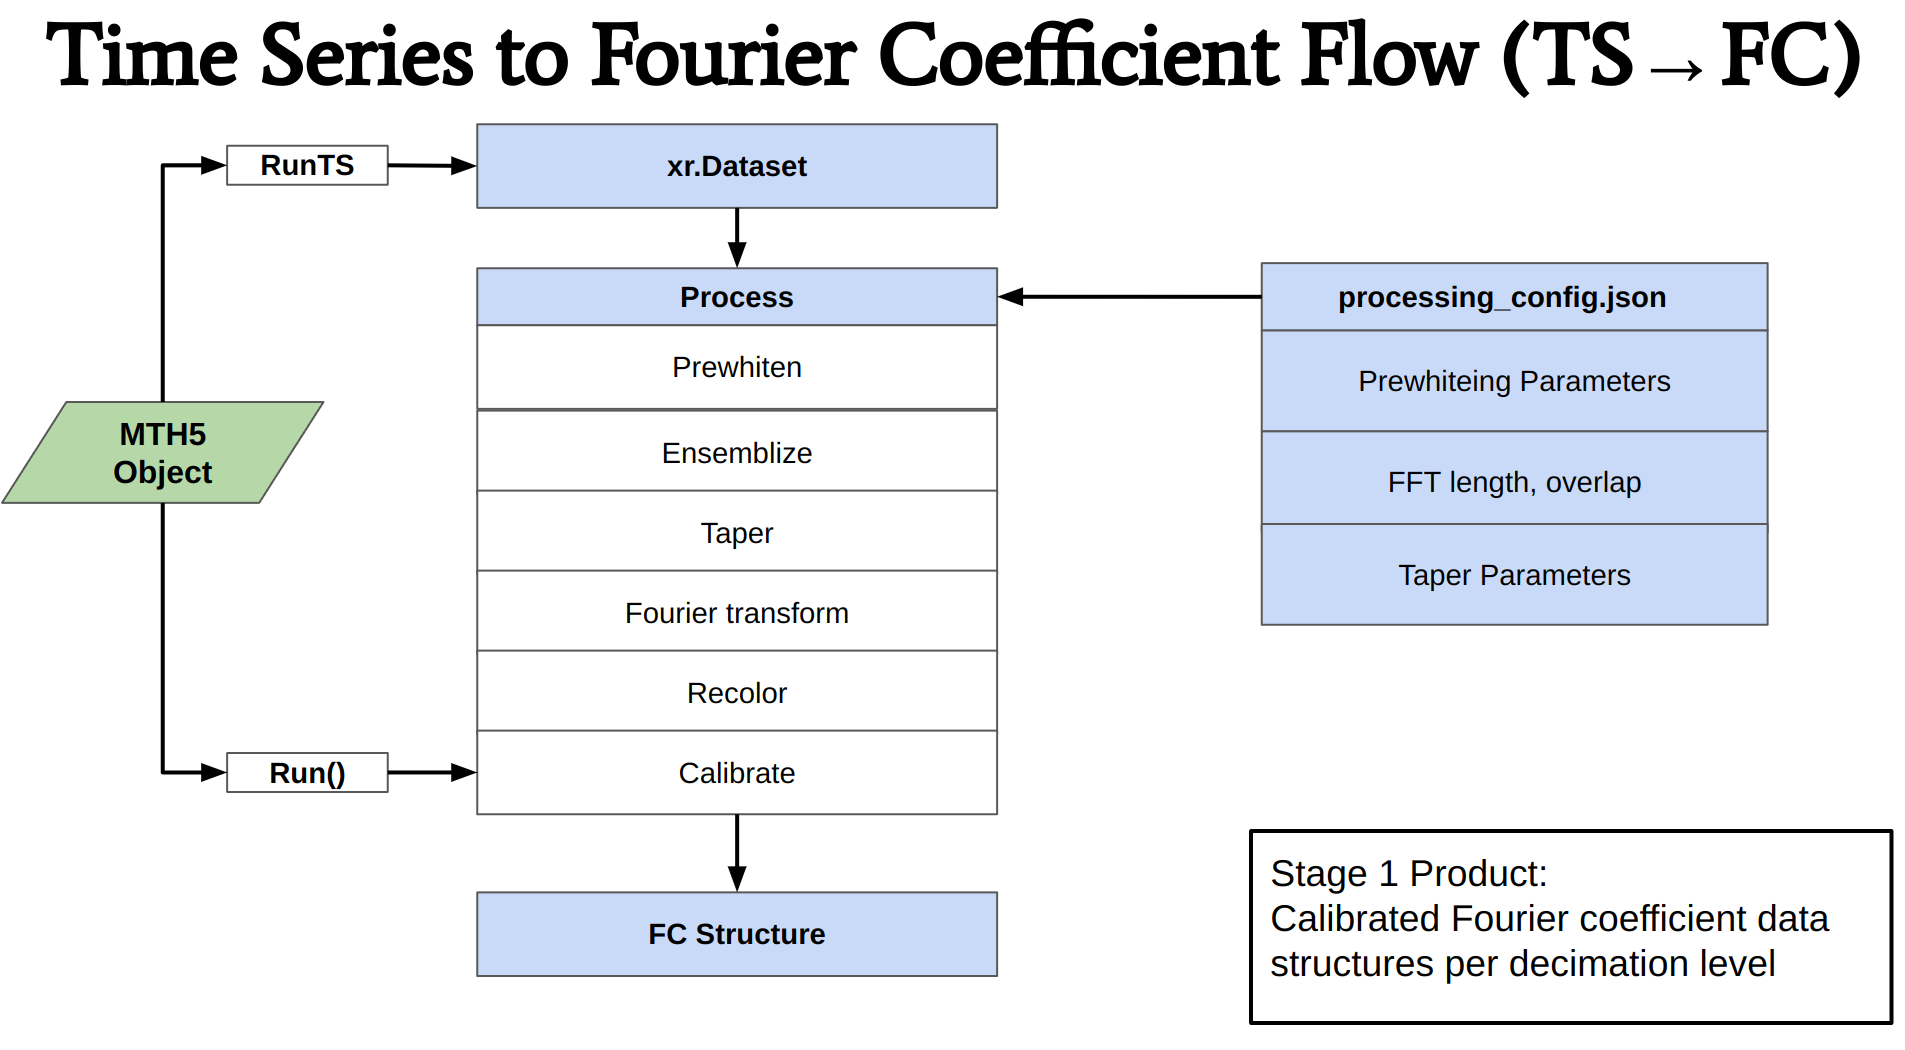
Image("figures/detailed_flow_2_of_2.png")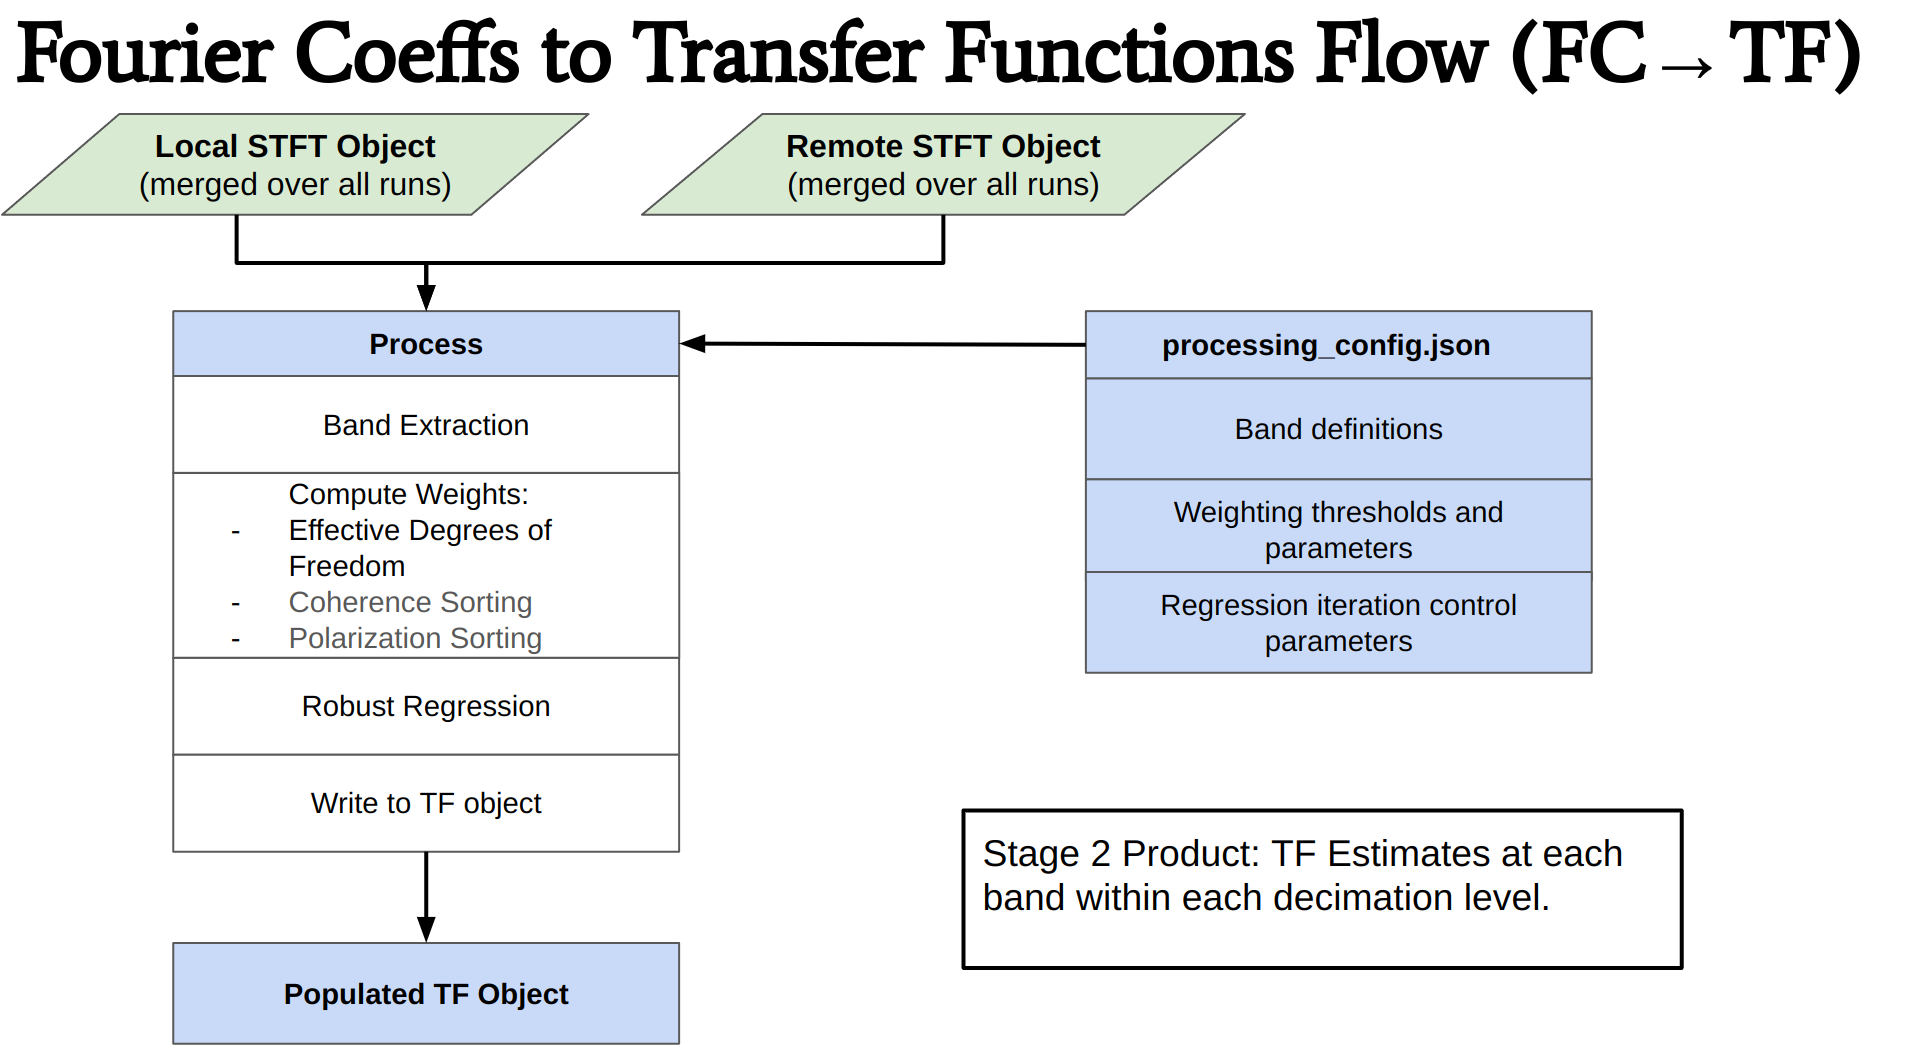
Image("figures/core_data_structures.png")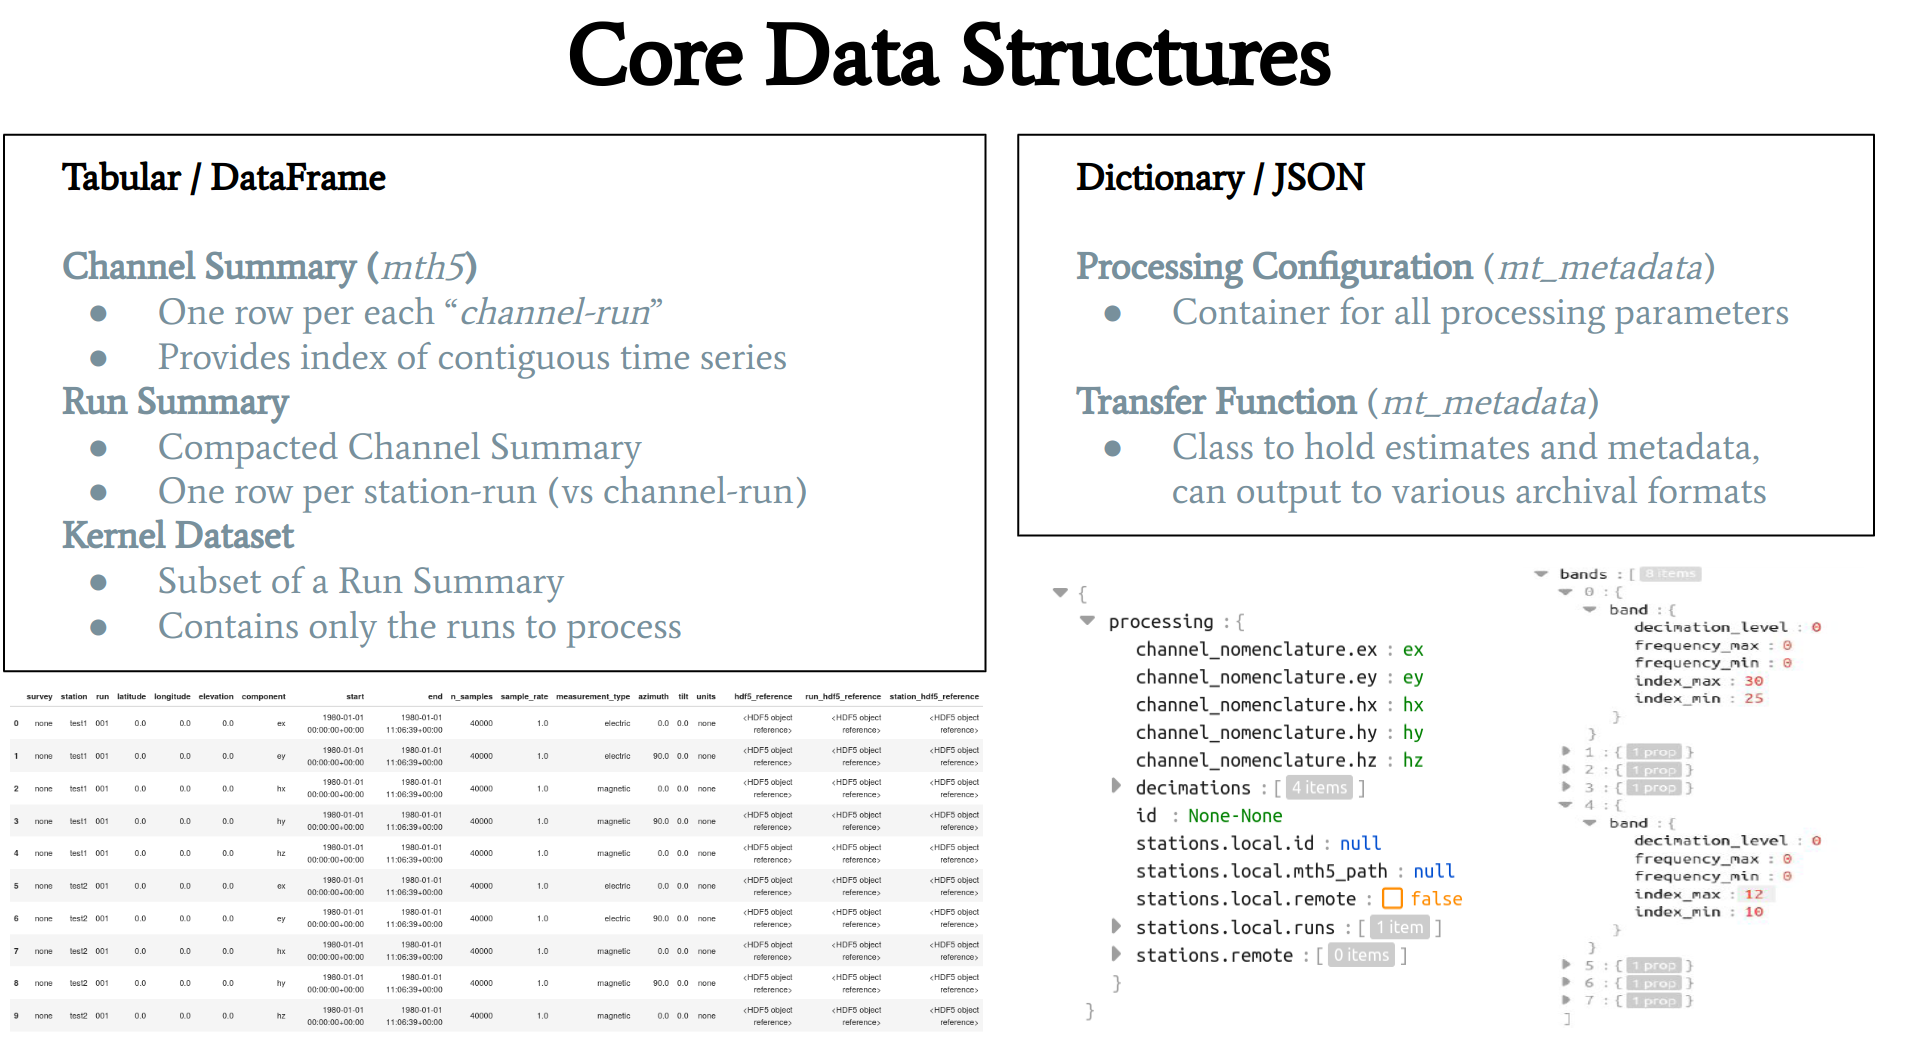
Image("figures/run_summary.png")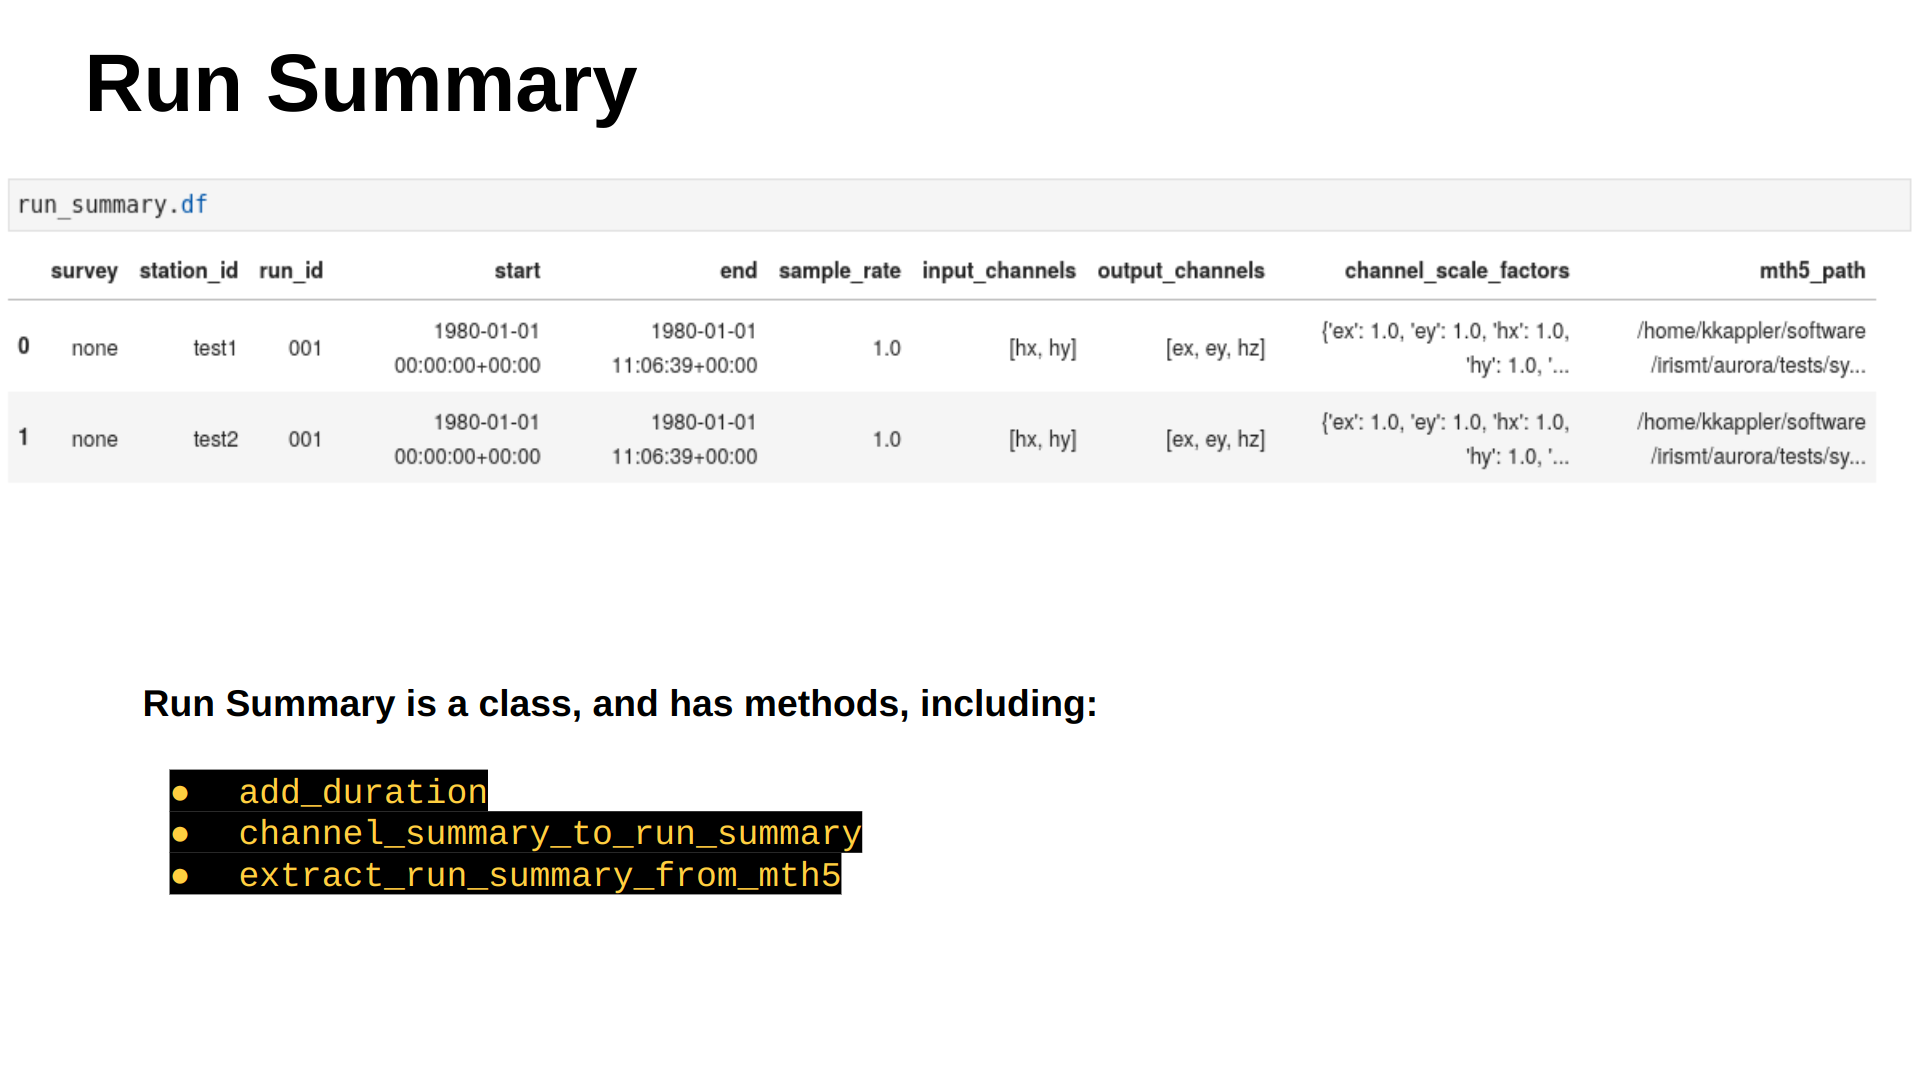
Image("figures/kernel_dataset.png")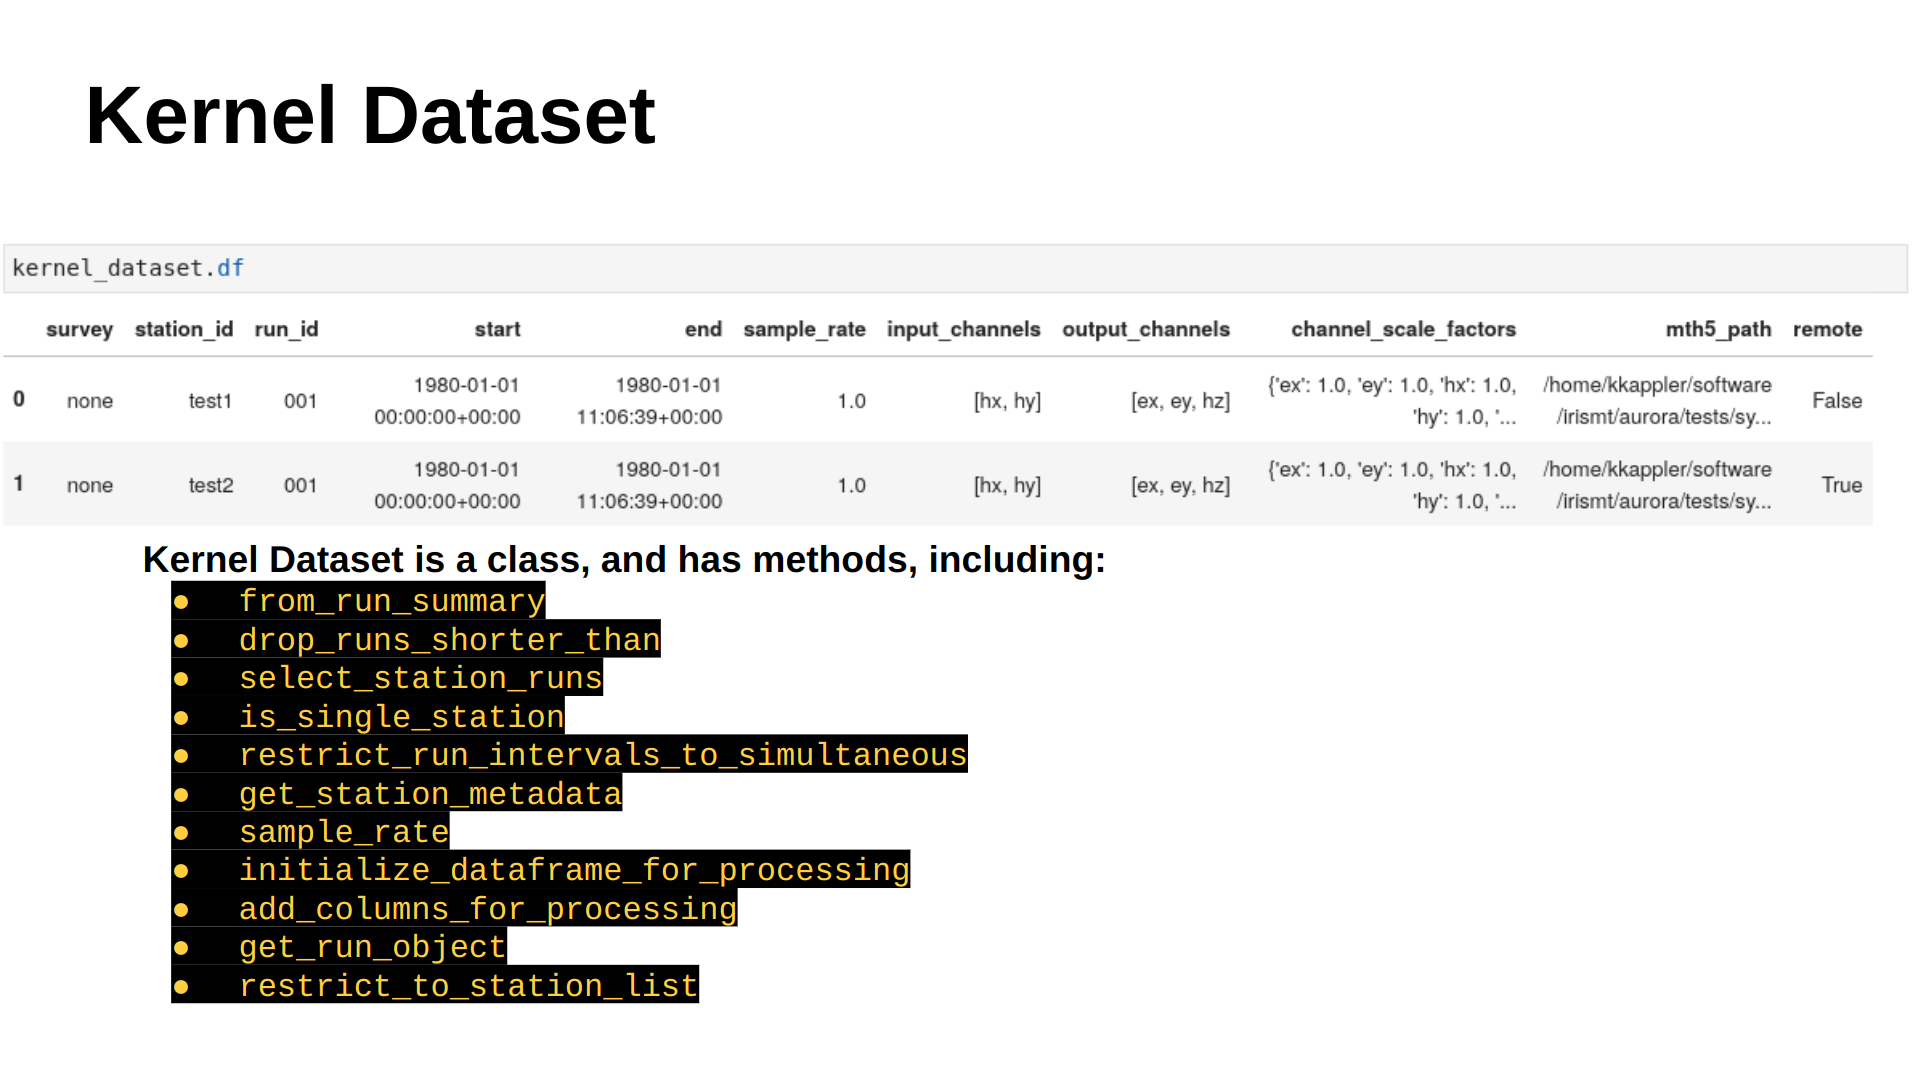
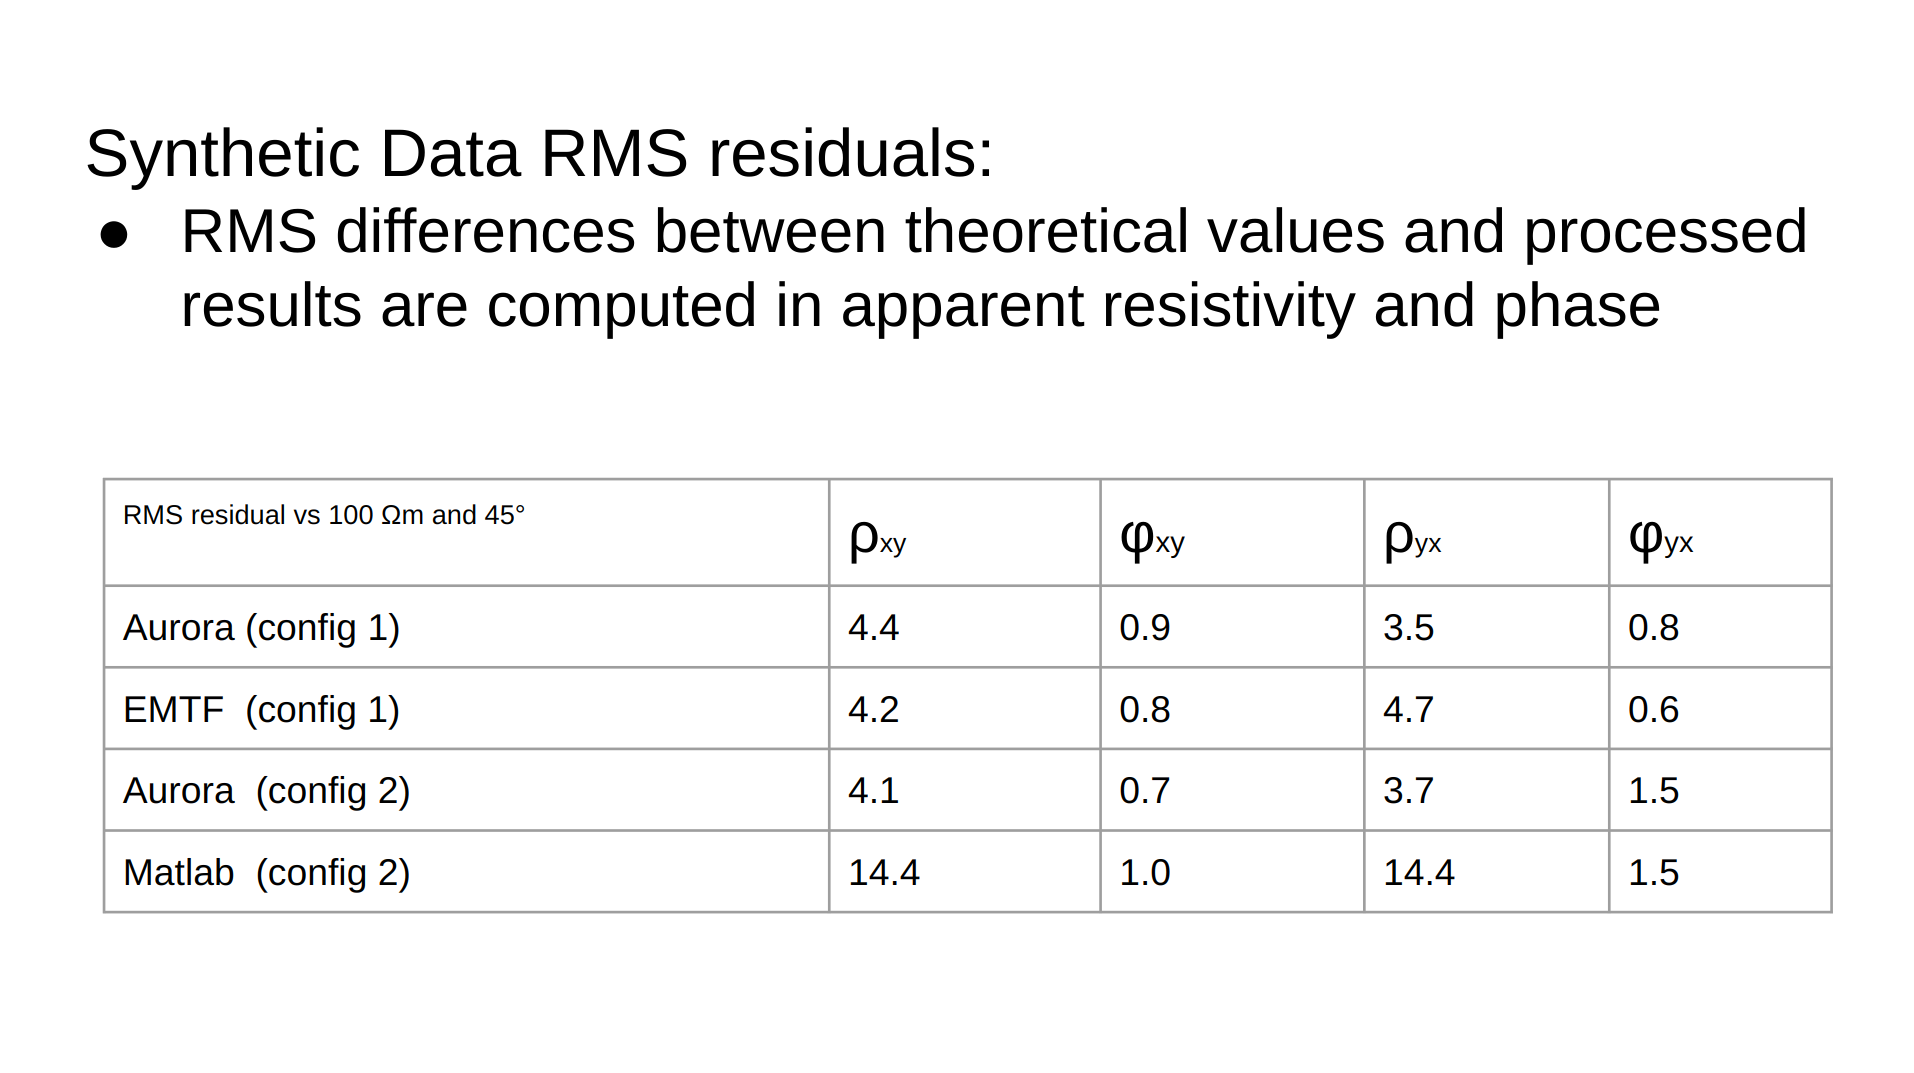
Synthetic Data Processing Results
Image("figures/synthetic_rho_phi_curves.png")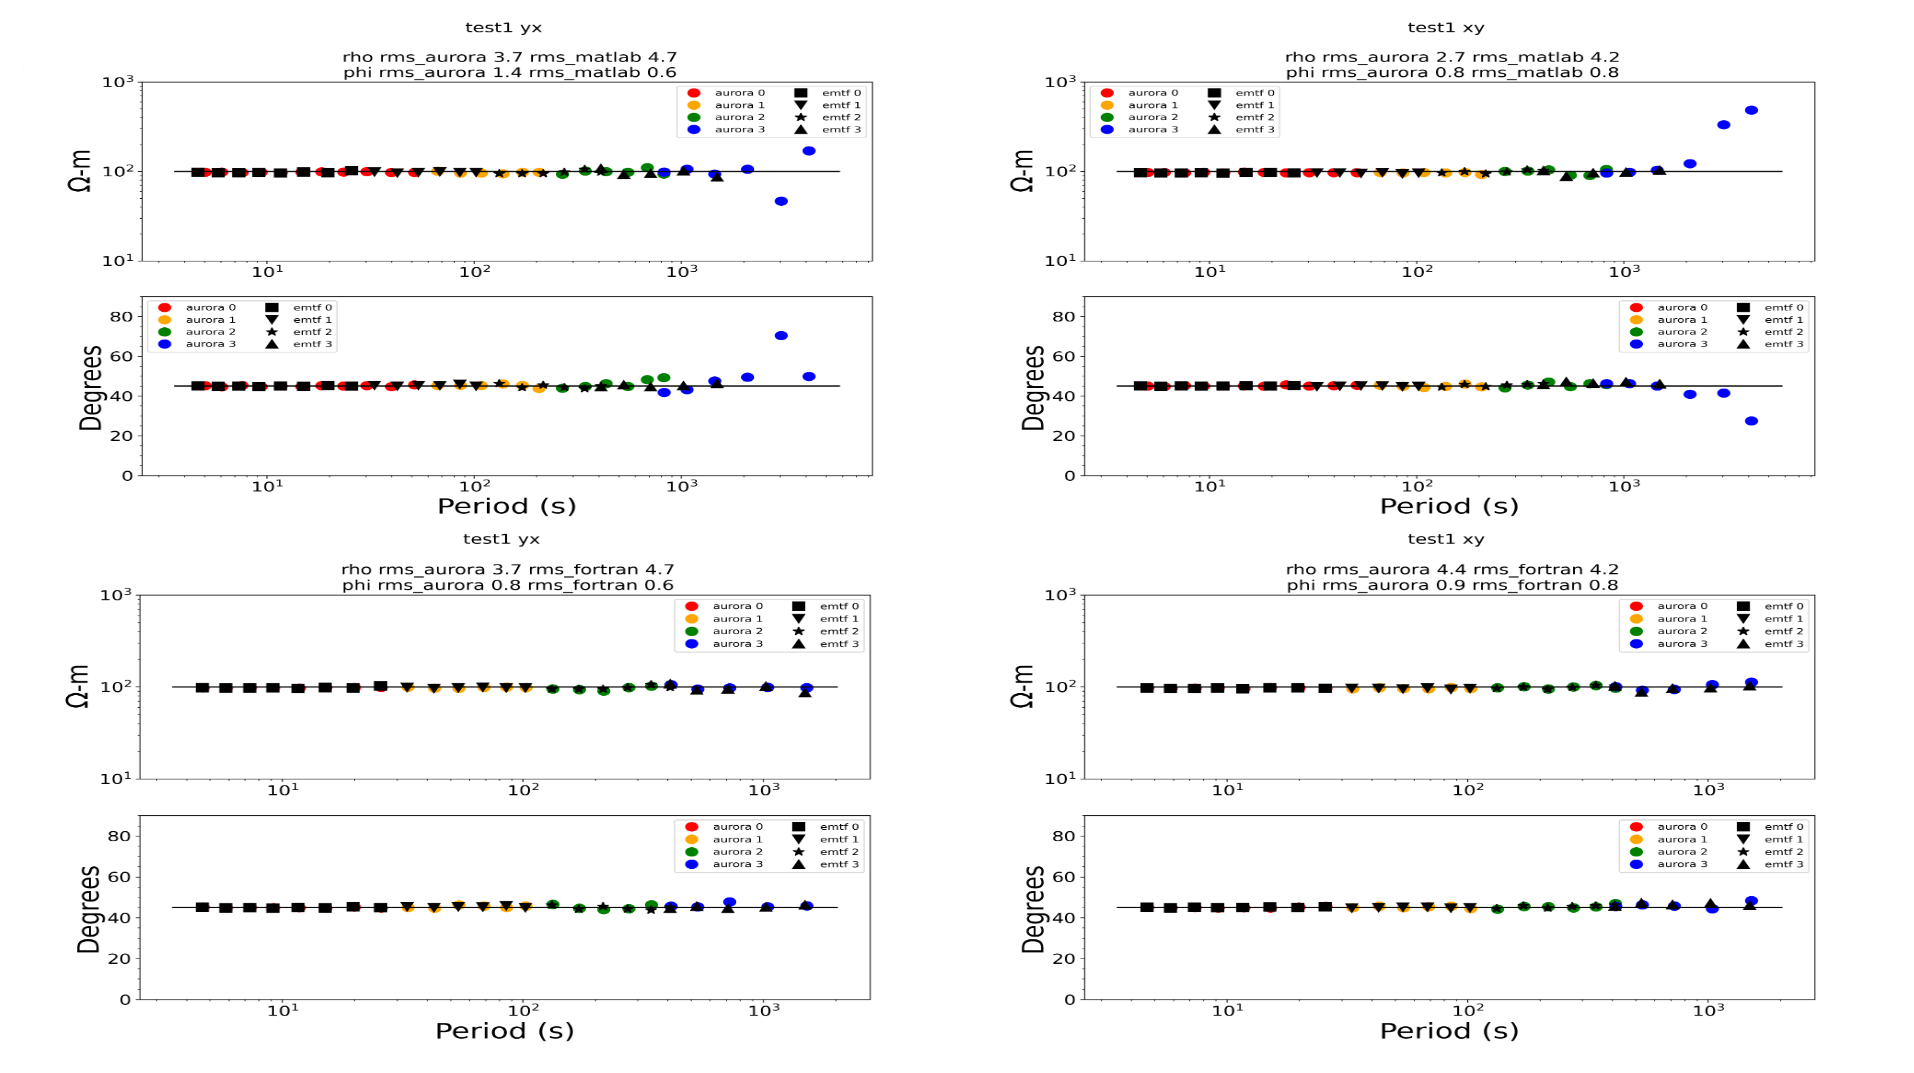
Image("figures/synthetic_tabulated_results.png")
Image("figures/minimal_code_example.png")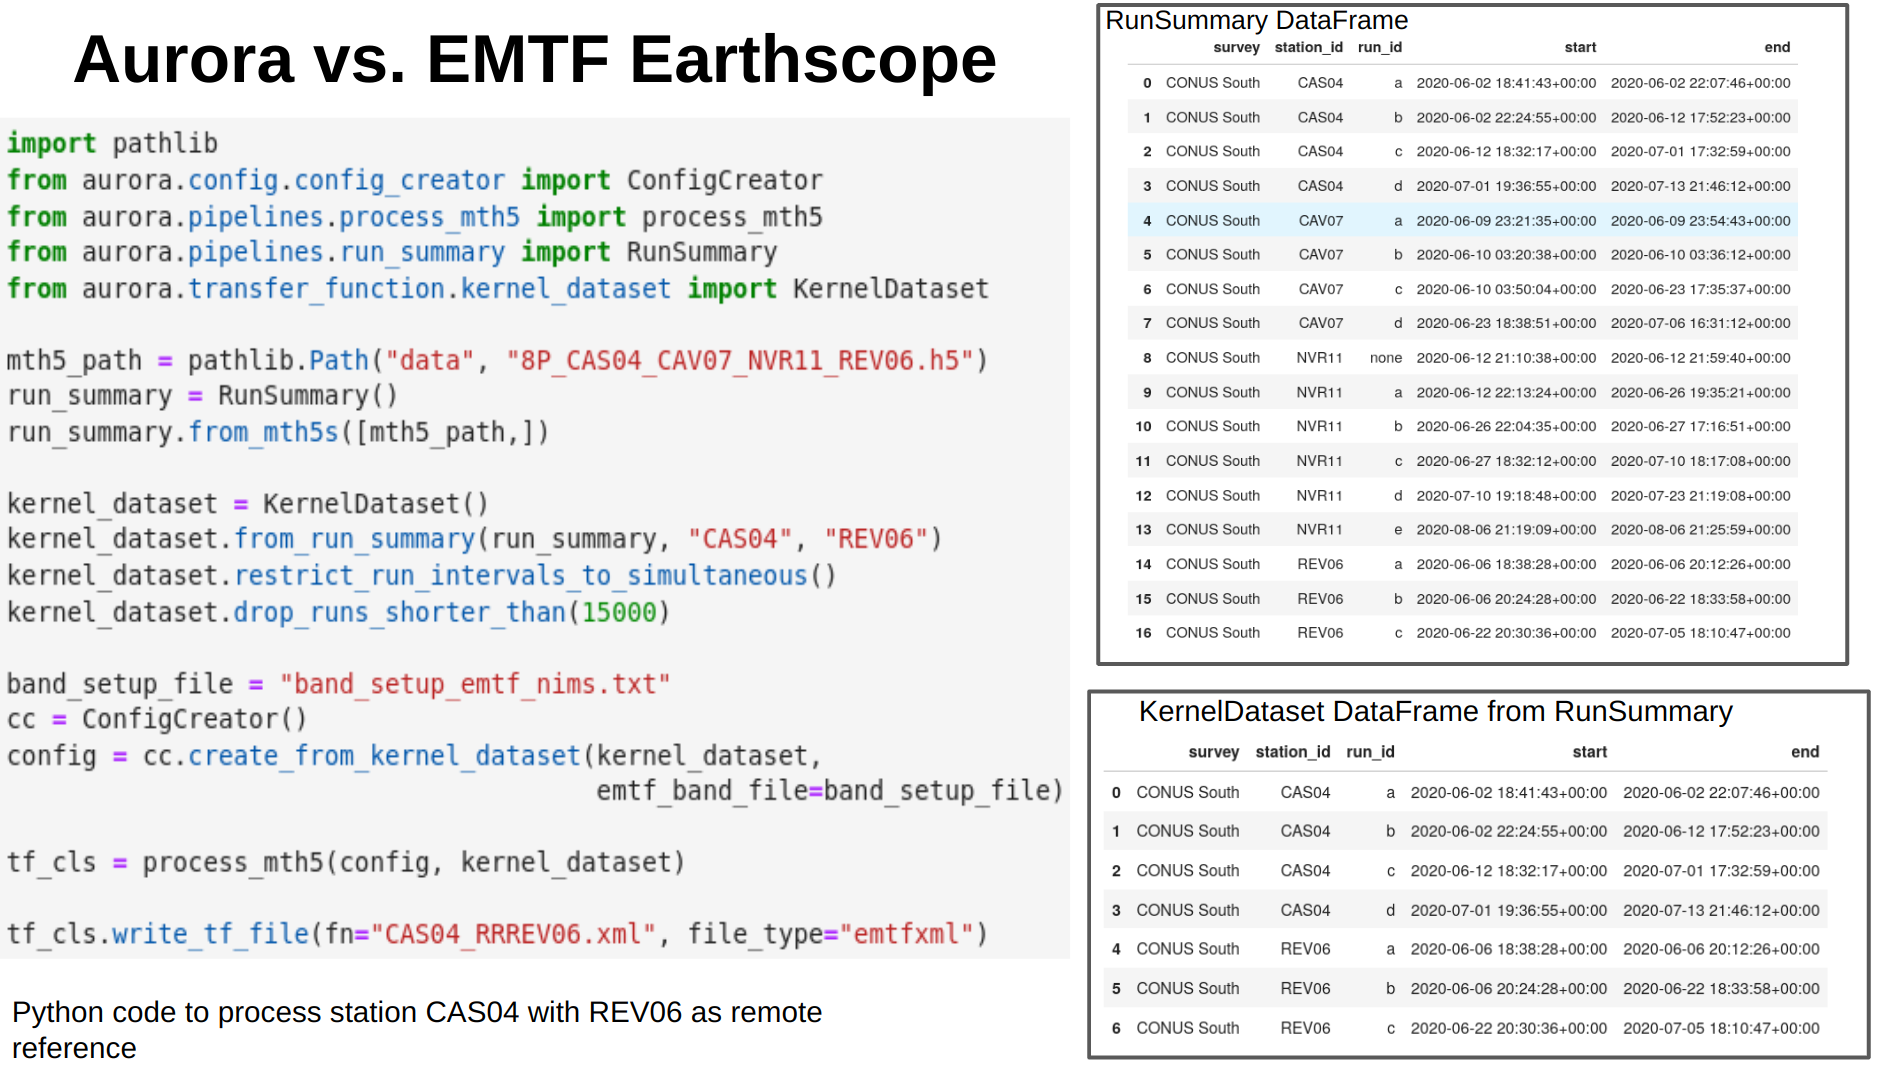
Image("figures/tf_comparison_cas04_with_remote_reference.png")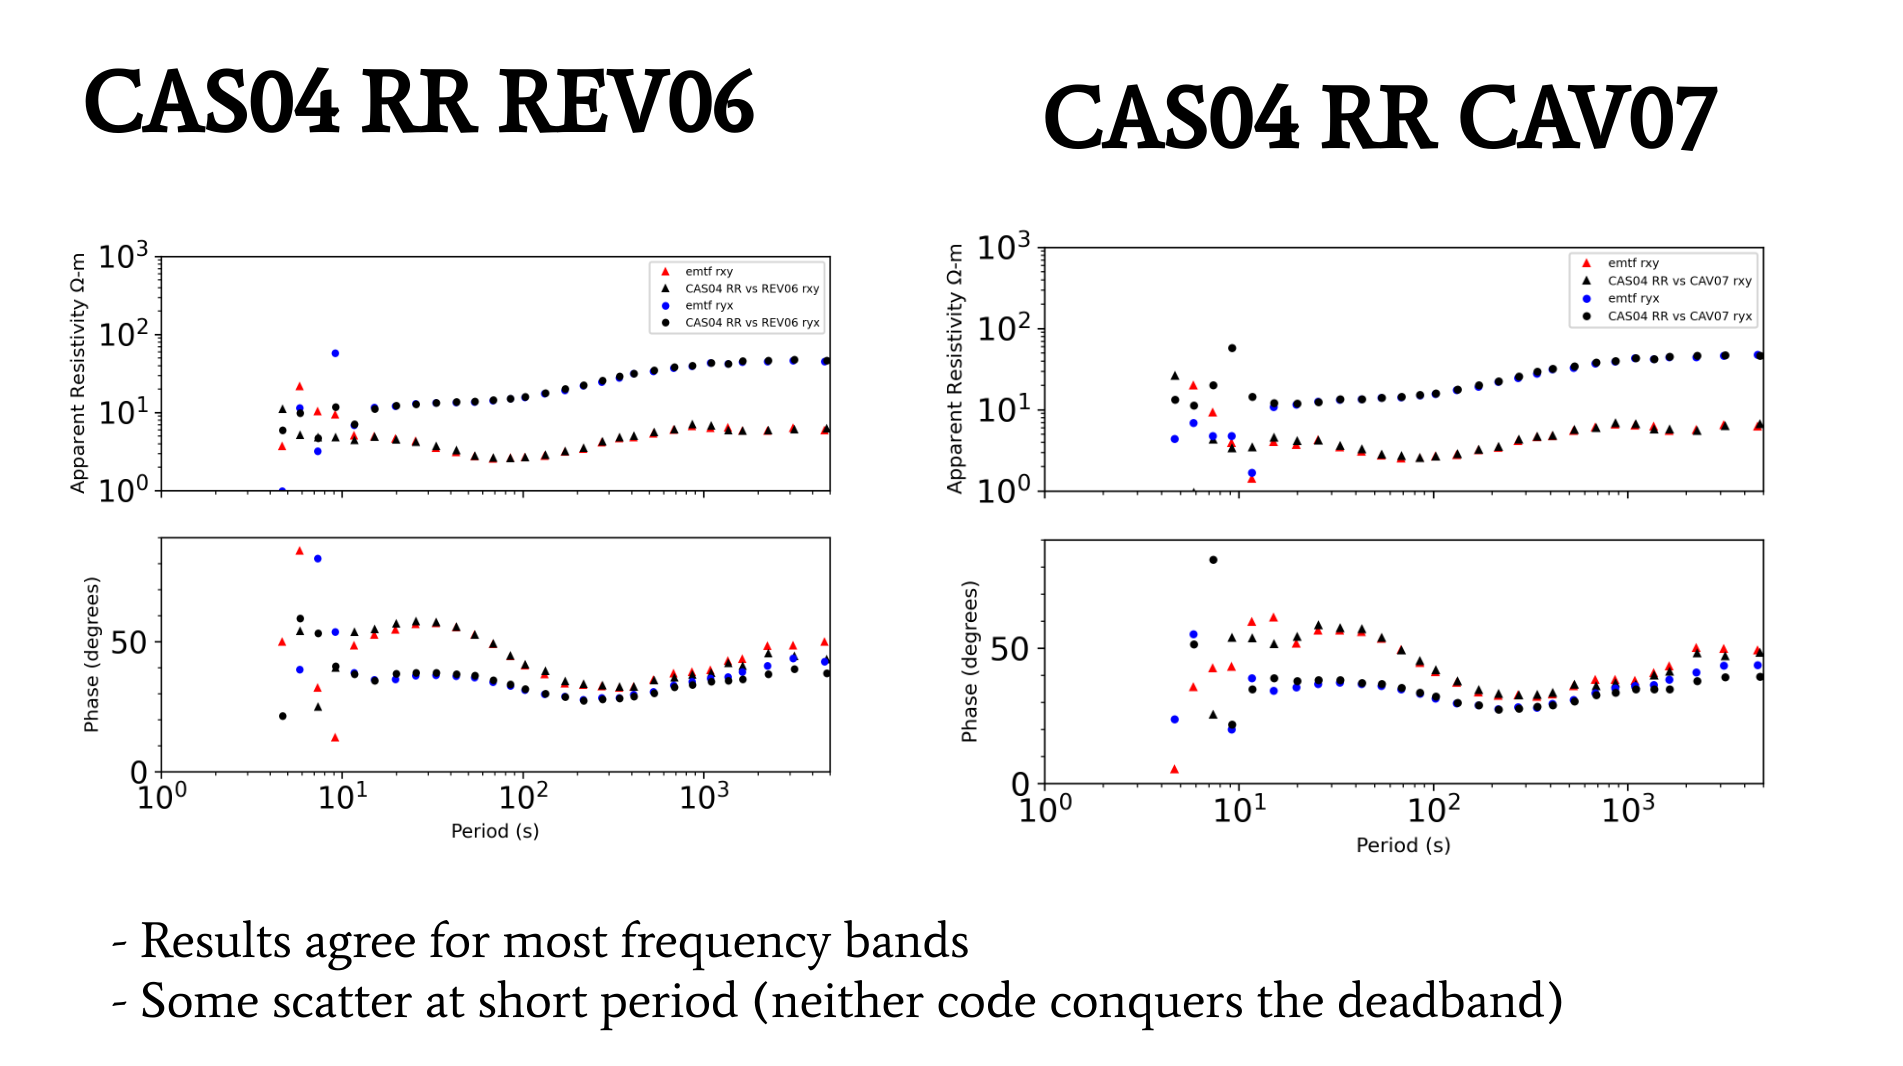
Image("figures/widescale_tests_histograms.png")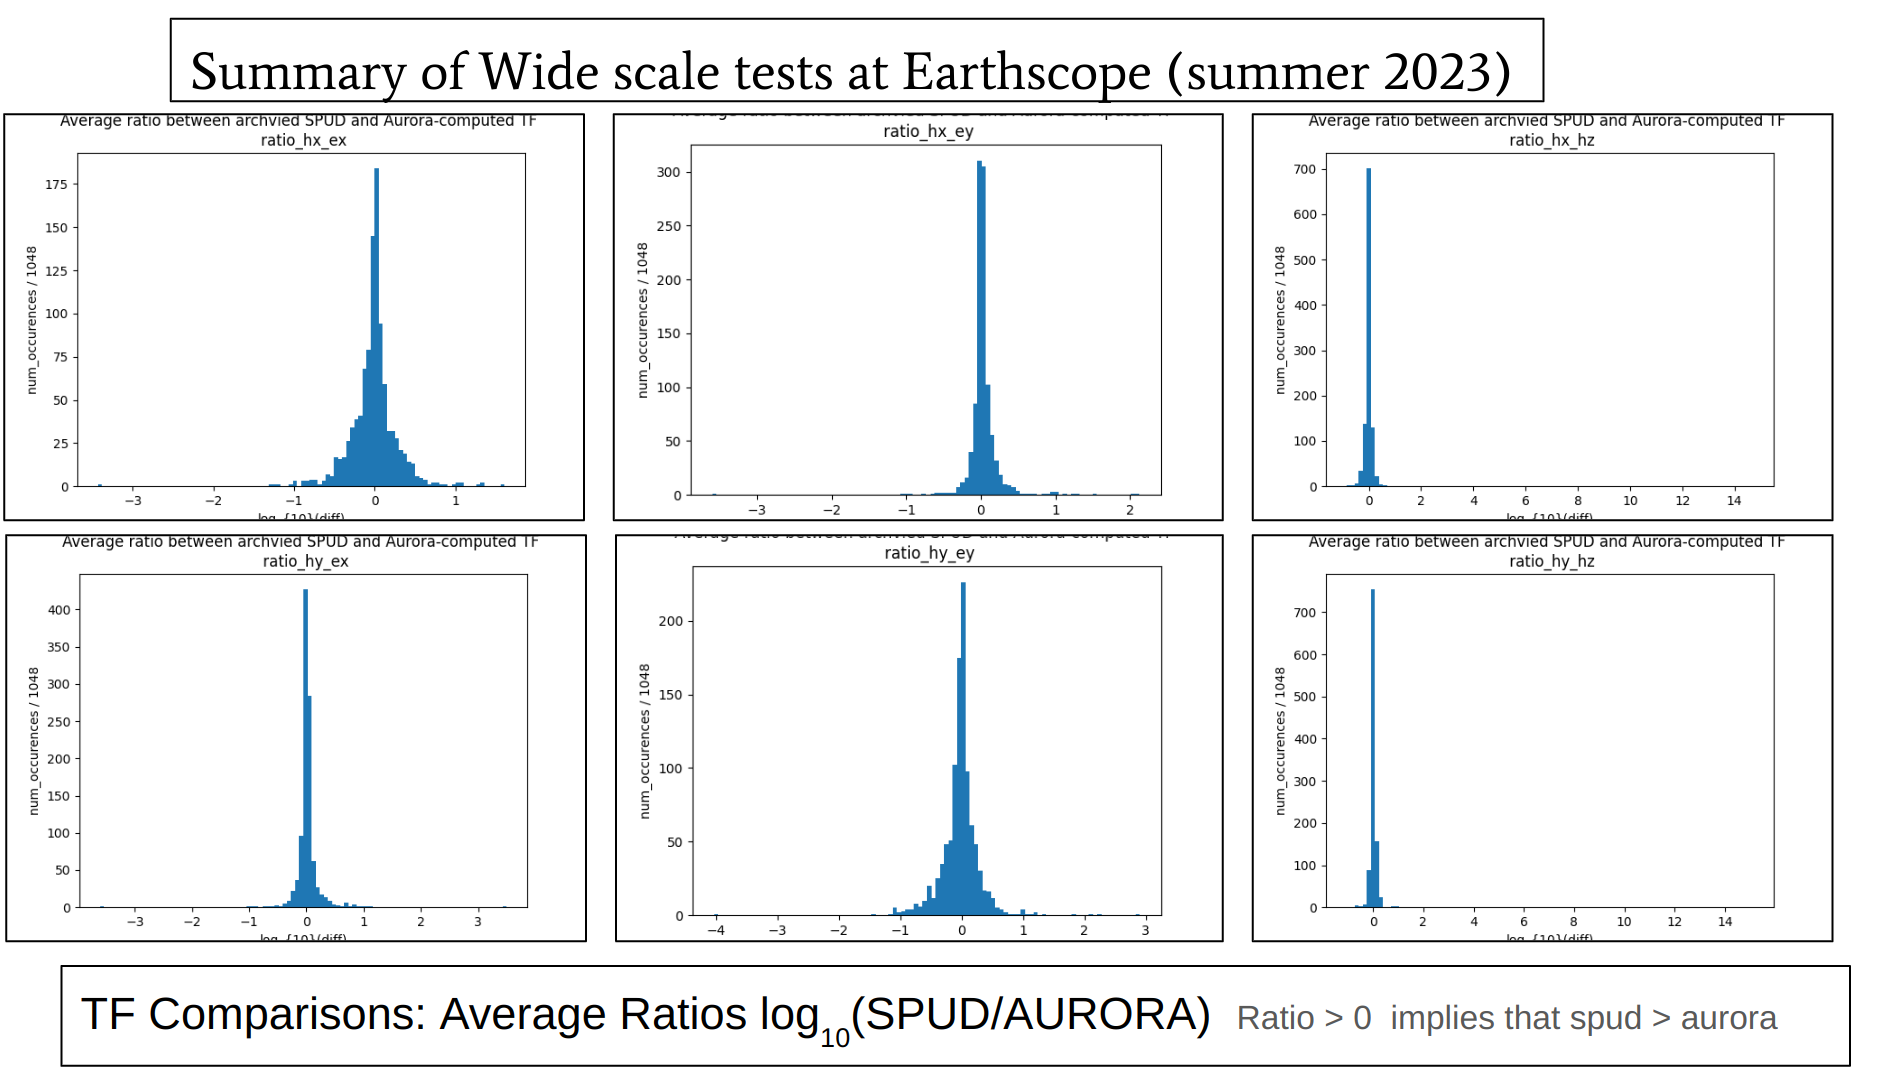
Recent Updates
Processing Summary and Processing Pre-check:
Processing Summary “melts” decimation levels over runs in Kernel Dataset
One row per (decimation_level, run) pair
Validiaty checks on each row before processing to ensure consistency between Data and Processing Parameters
Provides an iterator for building FC layer
Fourier Coefficient (“FC”) Group in MTH5:
Removes need to re-compute if testing weights and regression schemes
Aurora checks for stored FCs consistent with the Processing Configuration
If present, they are used for TF estimation
Wide scale testing on >1000 Time Series and TFs archived at Earthscope
PyPI release: pip install aurora=0.4.2
Now installs as part of MTPy
Limitations
Can only use a one remote reference station Vs. multiple station simultaneous processing (full matrix of spectral cross power)
Assumes 3-,4-,or 5-channel stations
Limited data cleaning algorithms
Huber’s Regression M-Estimate implemented,
Time domain cleaning not implemented
Limited data visualization capability
No handling for gaps / interpolation
Future Work
Plug-ins for:
other open source MT codes, birrp-based TFs, etc.
Weights: coherency sorting, polarization sorting, etc.
ARMA prewhitening
Data Imputation
Multiple station processing regression engine
Expand testing suite:
Multiple benchmark datasets
More synthetic data cases
Align with IAGA Div VI TaskForce for Data interoperability
Community testing on benchmark datasets
HPC Applications
Longer term future work
Moving platform data
Allow Natural Fields processing of Induced polarization and DC resistivity layouts
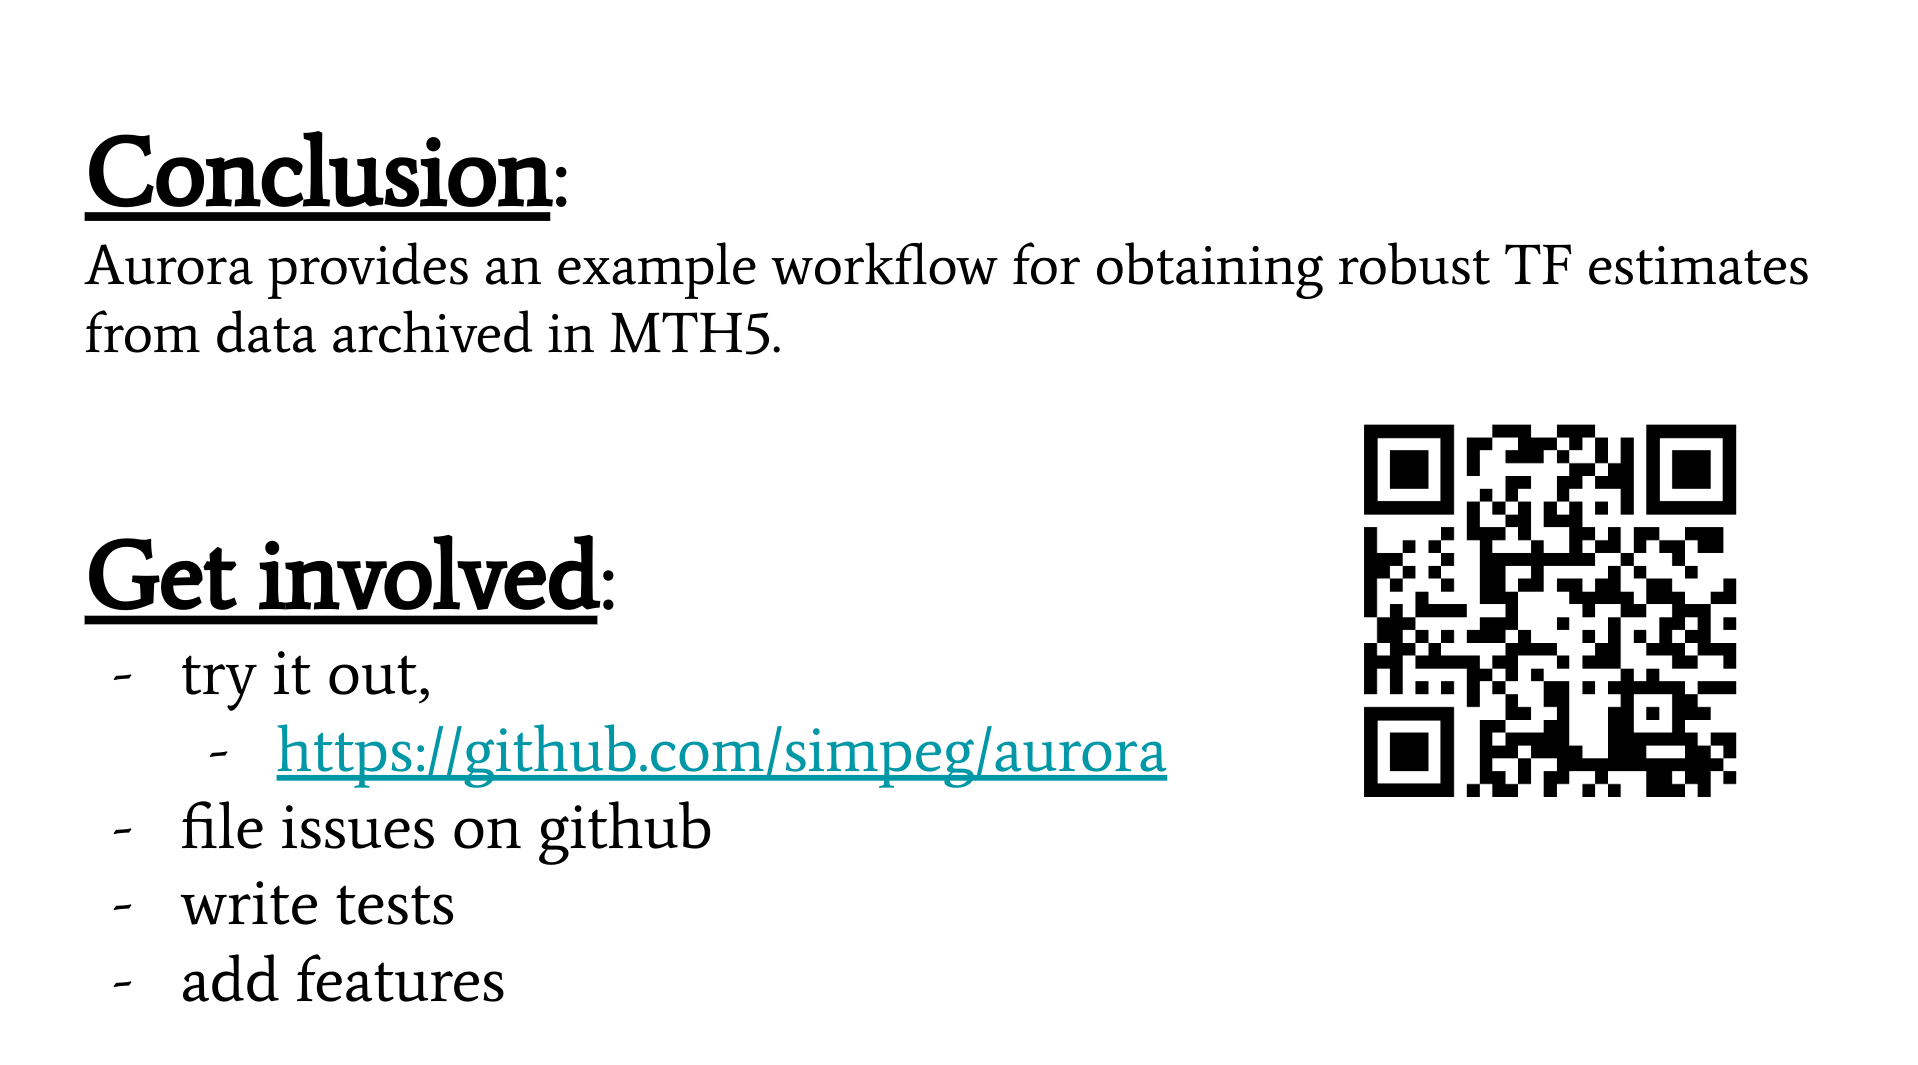
Conclusion:
Aurora provides an example workflow for obtaining robust TF estimates from data archived in MTH5.
Get involved:
Try it out
Now comes installed with mtpy-v2,
File issues on github
Write tests
Add features
Back Up Slides
Image("figures/mt_sources_and_amplitudes.png")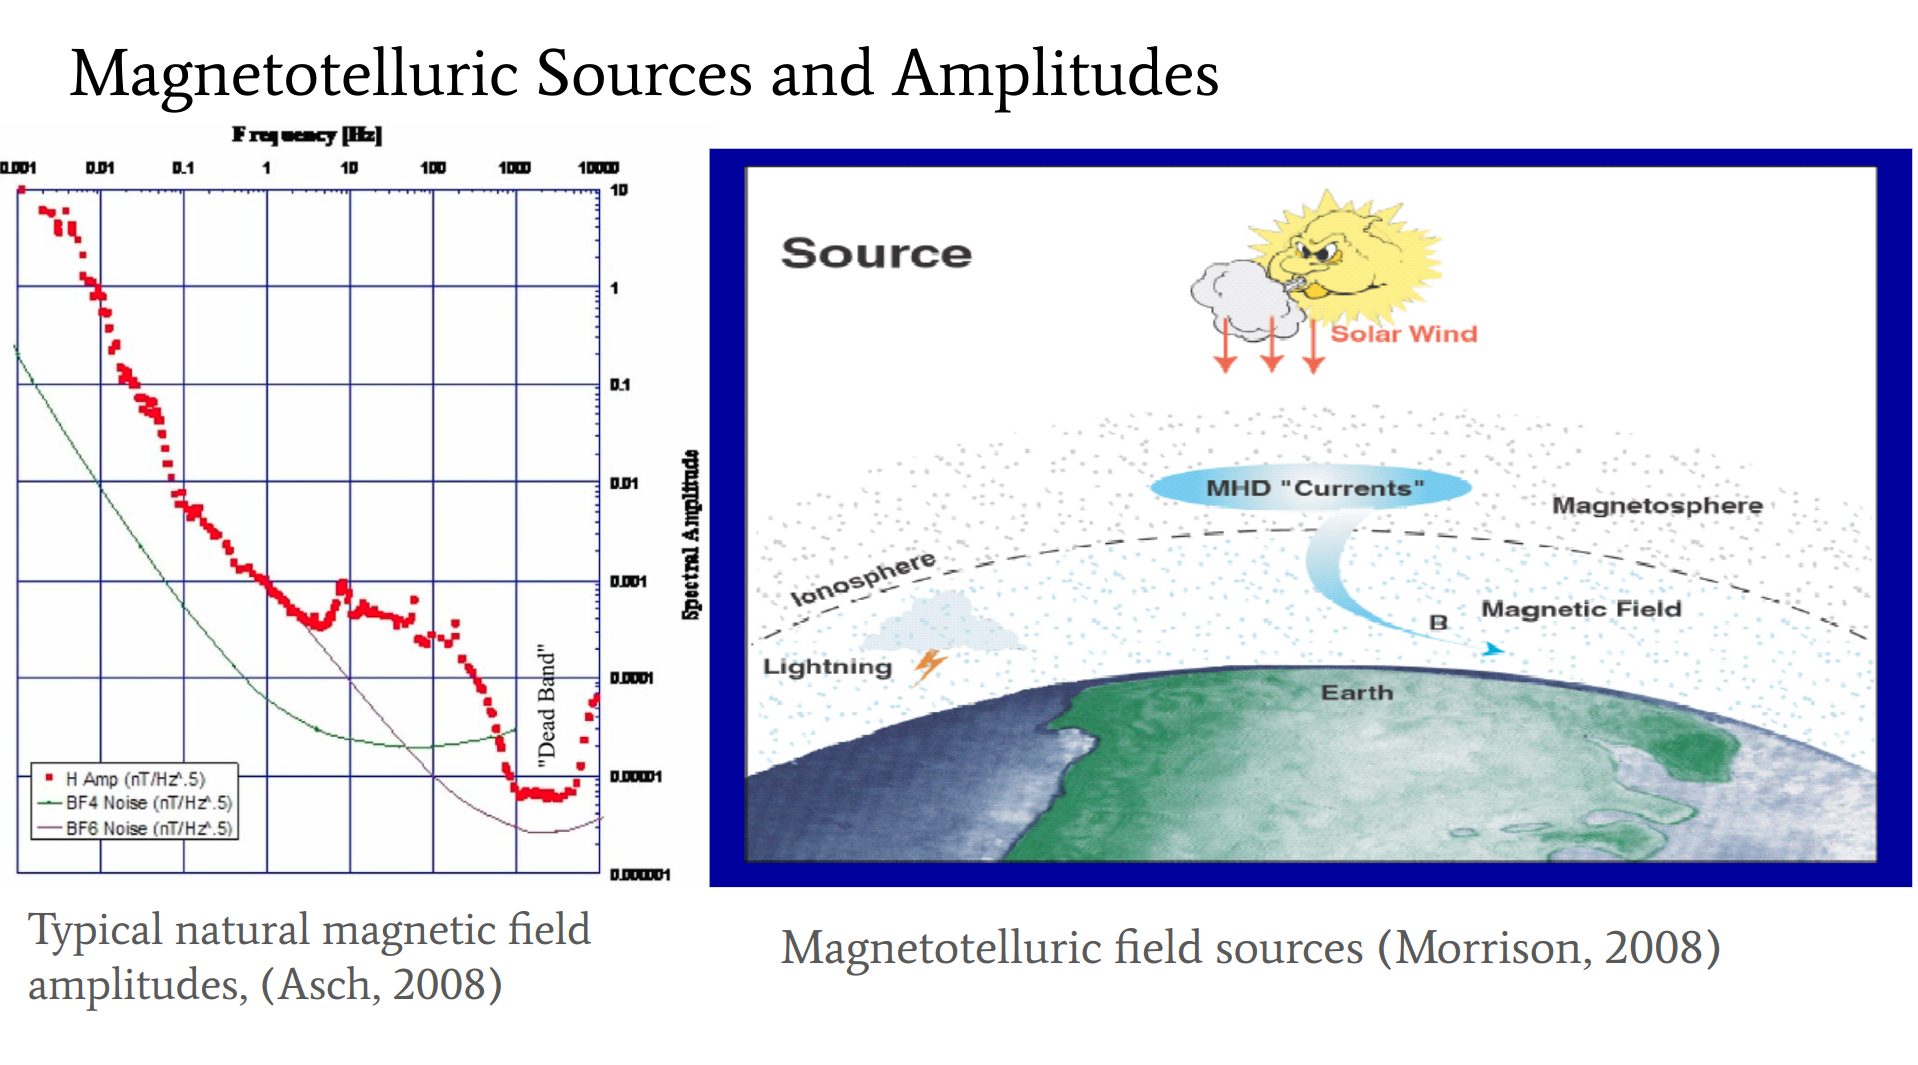
Image("figures/standards_proliferate_translators.png")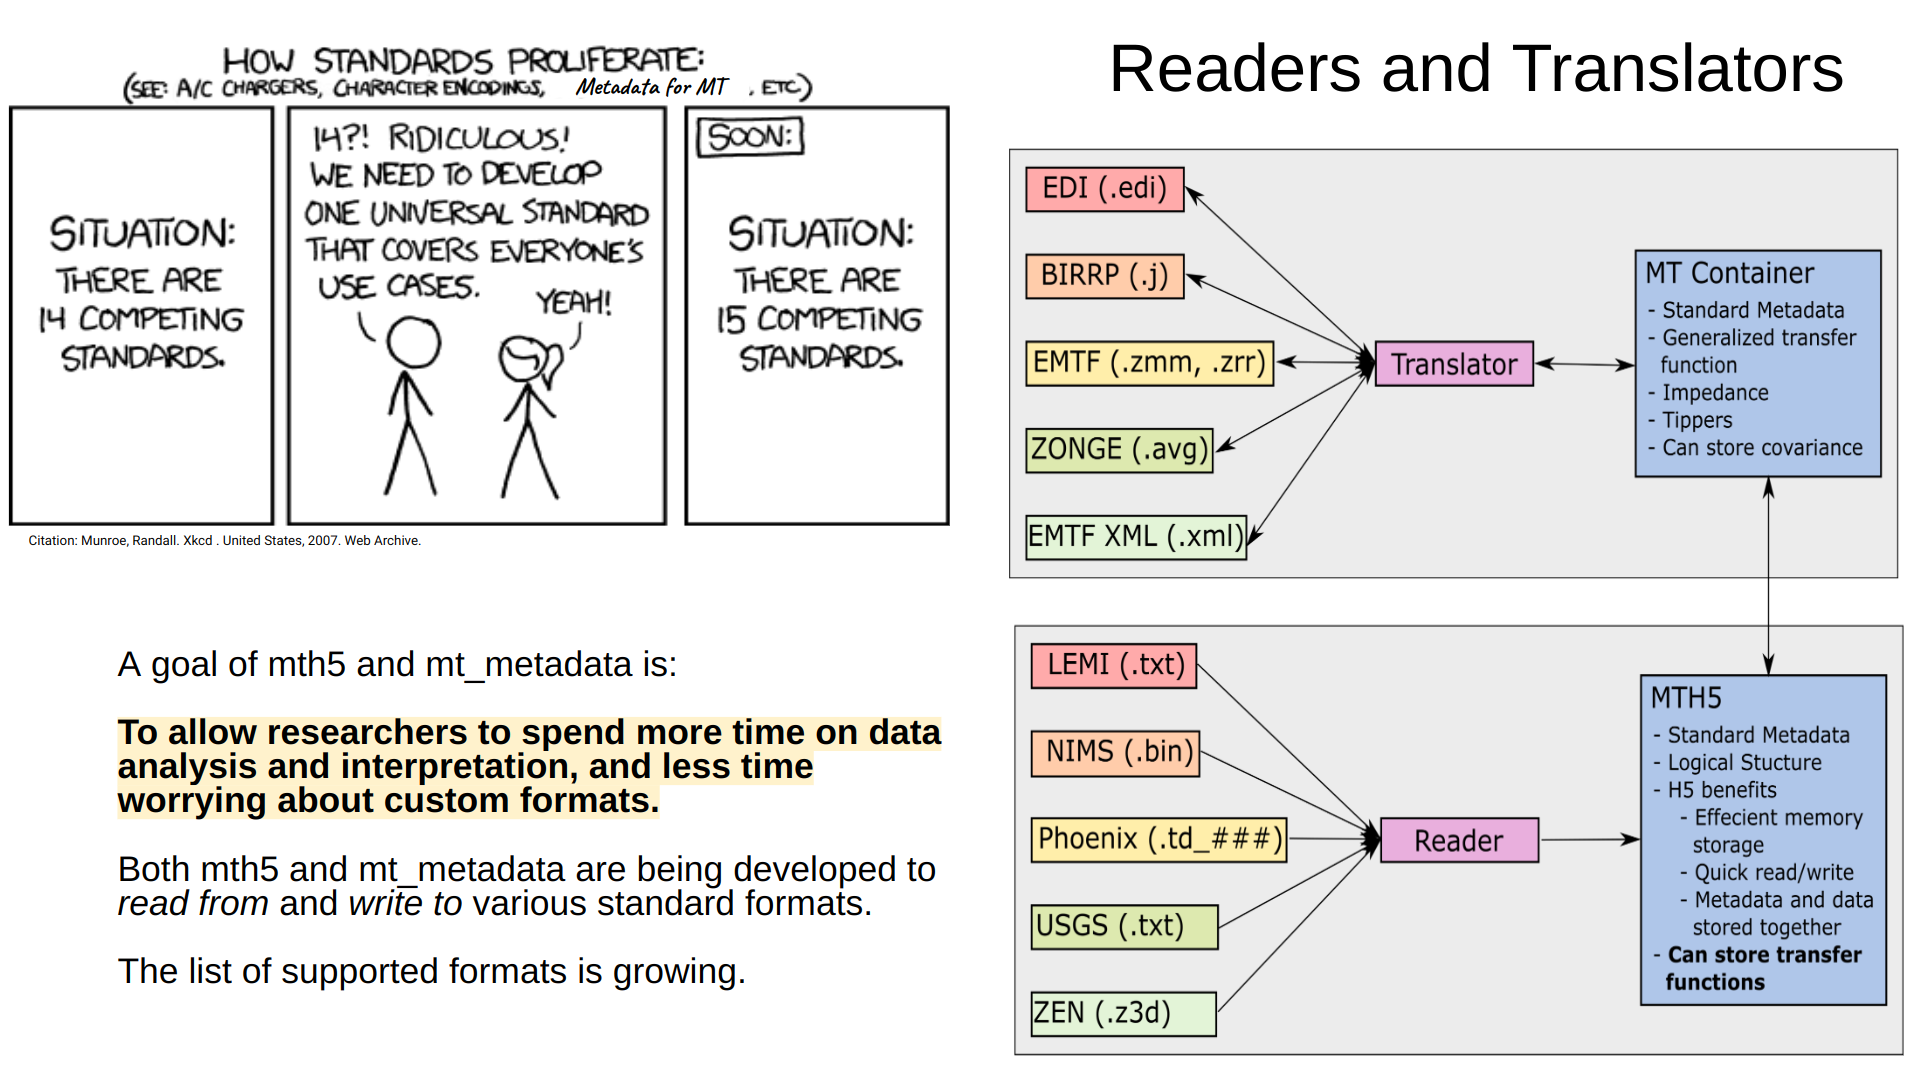
Image("figures/what_do_the_time_series_look_like.png")
Image("figures/why_three_packages.png")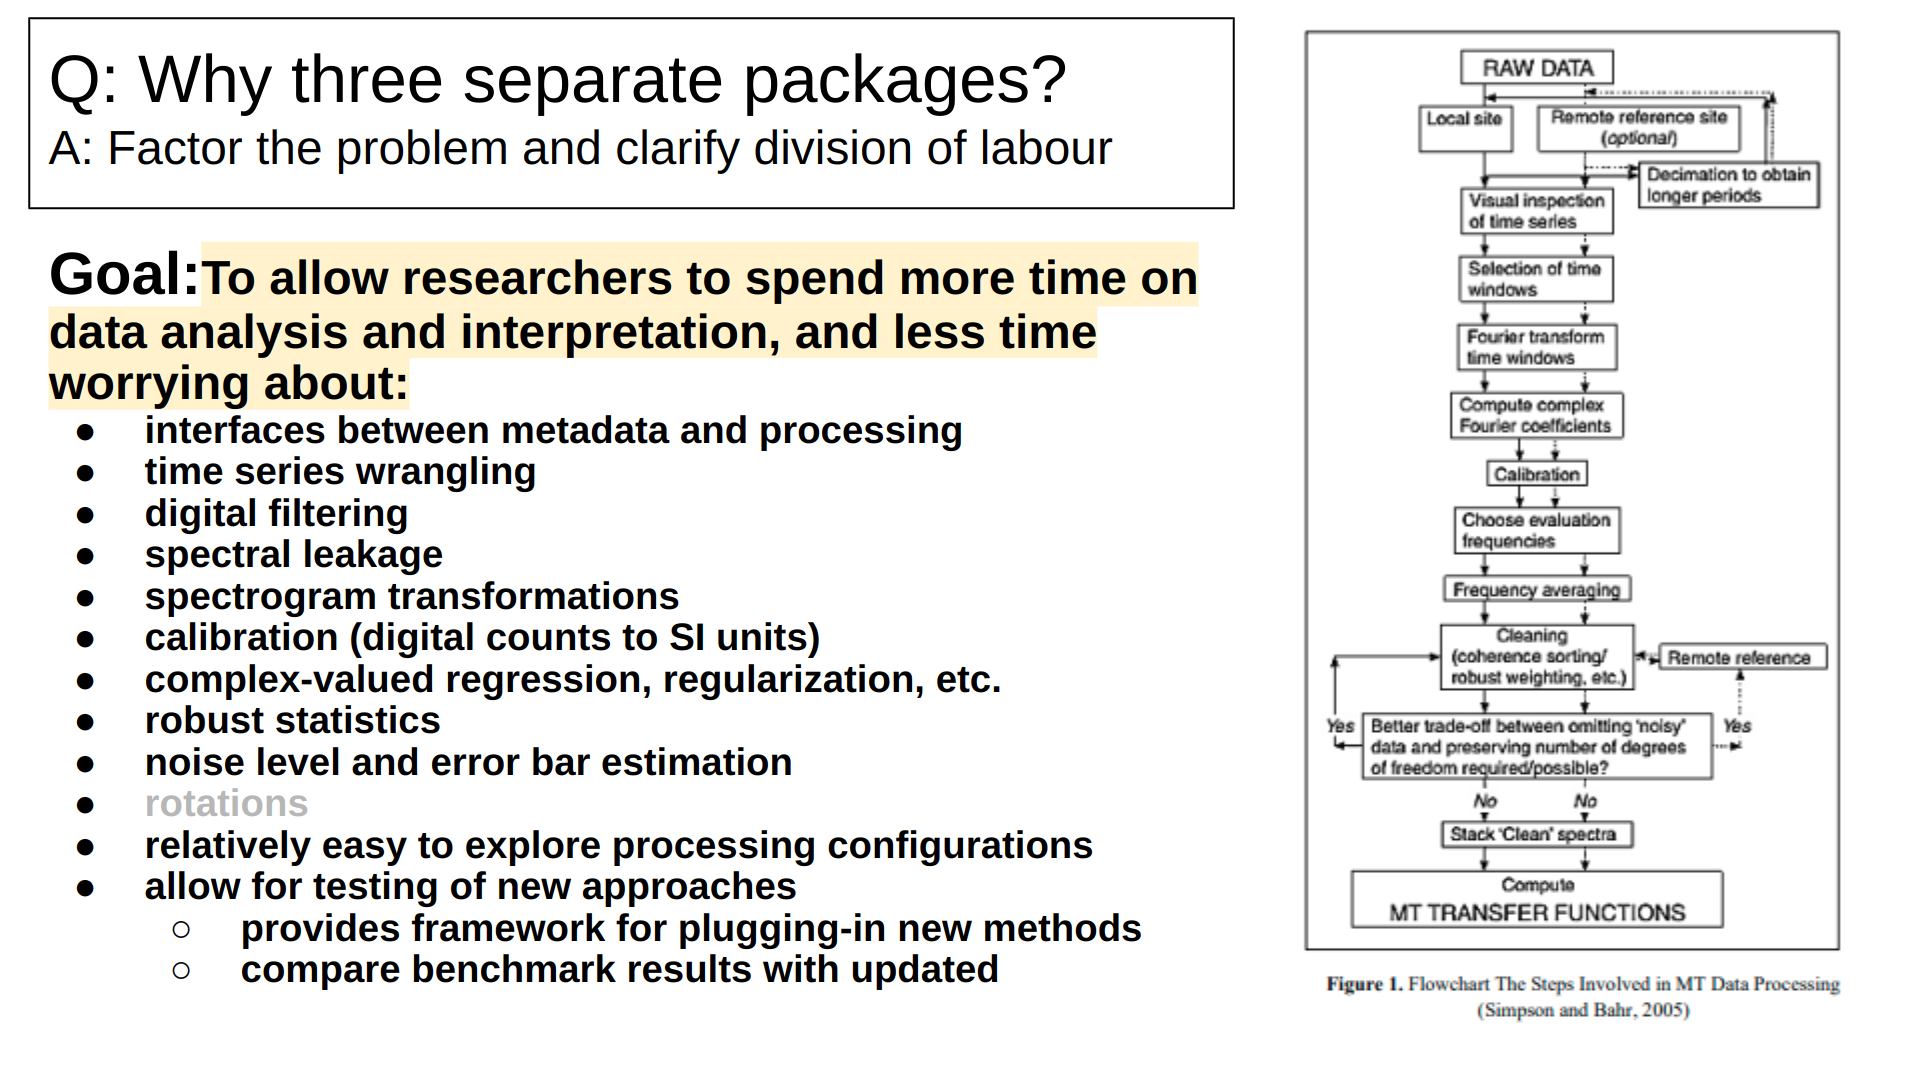
Image("figures/cascading_decimation.png")
Image("figures/potpourri.png")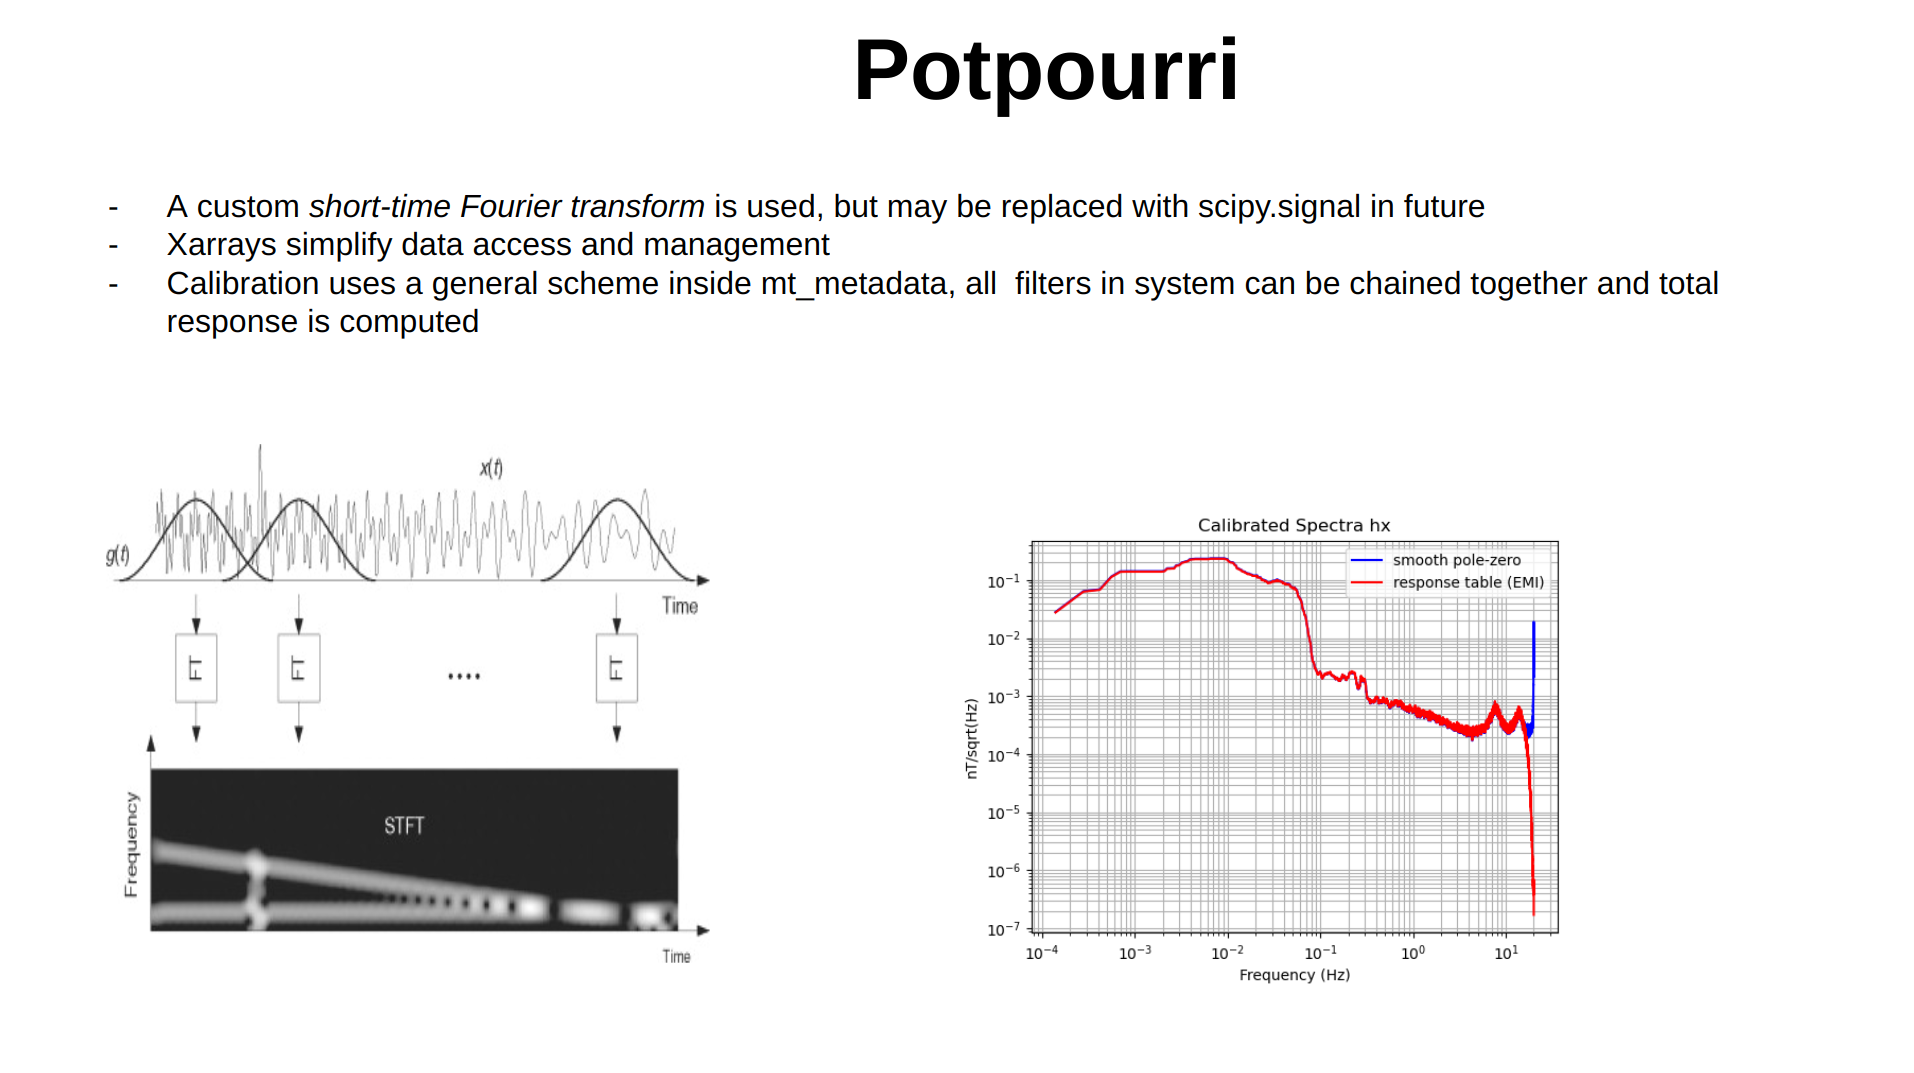
Image("figures/schumann_01.png")
Image("figures/schumann_02.png")
Image("figures/why_three_packages.png")Image("figures/recent_updates.png")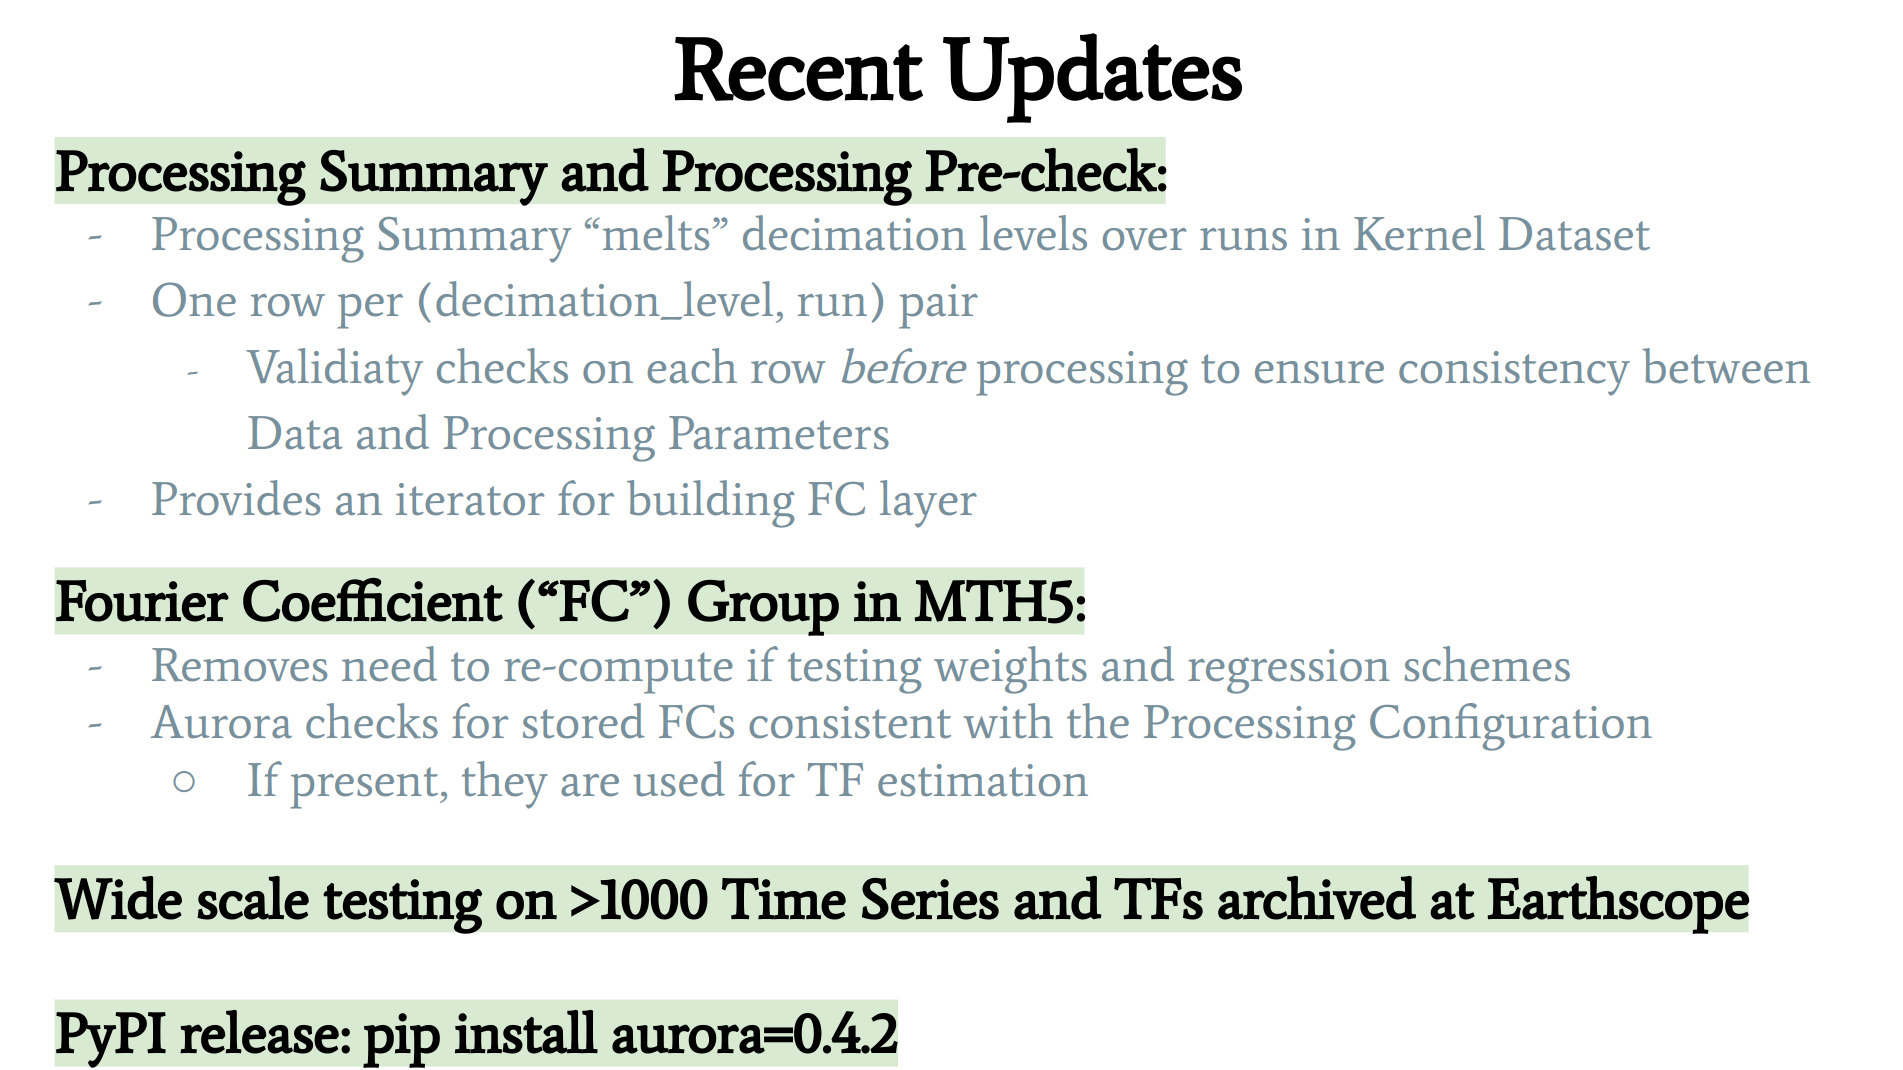
Image("figures/conclusion.png")
!ls figures/*pngfigures/00a_aurora_backdrop_screenshot_with_credits.png
figures/01_joss_manuscript_cover.png
figures/aurora_backdrop.png
figures/cascading_decimation.png
figures/conclusion.png
figures/core_data_structures.png
figures/data_processing_ecosystem.png
figures/detailed_flow_1_of_2.png
figures/detailed_flow_2_of_2.png
figures/github_tested.png
figures/kernel_dataset.png
figures/minimal_code_example.png
figures/mt_sources_and_amplitudes.png
figures/potpourri.png
figures/process_flow_high_level_paper_figure_2.png
figures/process_flow_main_interfaces.png
figures/recent_updates.png
figures/run_summary.png
figures/schumann_01.png
figures/schumann_02.png
figures/standards_proliferate_translators.png
figures/synthetic_rho_phi_curves.png
figures/synthetic_tabulated_results.png
figures/tf_comparison_cas04_with_remote_reference.png
figures/tf_kernel_paper_figure_1.png
figures/what_do_the_time_series_look_like.png
figures/why_three_packages.png
figures/widescale_tests_histograms.png
figures/xkcd_standards.png
References:
Canberra Slides https://
2022 Workshop Slides https://
screenshots https://
EMIW 2024 Poster https://