Its common to look at observatory data for geomagnetic storms or to use as a remote reference. The USGS provides geomagnetic observatory data for observatories in North America. In the future this will be expanded to the various other observatories using well developed packages like geomagpy.
You will need to know ahead of time what observatories you would like to download data from, dates, and type of data. There are no wildcards. See USGS Geomagnetic webservices for more information on allowed options.
Here we will download 2 days of data from 2 different observatories for the x and y components of calibrated data (‘adjusted’).
import pandas as pd

from mth5.clients import MakeMTH5
2023-03-23 15:44:33,968 [line 135] mth5.setup_logger - INFO: Logging file can be found C:\Users\jpeacock\OneDrive - DOI\Documents\GitHub\mth5\logs\mth5_debug.log
Create a request DataFrame
The request input is in the form of a pandas.DataFrame with the following columns
| Column | Description | Options |
|---|---|---|
| observatory | Observatory code | BDT, BOU, TST, BRW, BRT, BSL, CMO, CMT, DED, DHT, FRD, FRN, GUA, HON, NEW, SHU, SIT, SJG, TUC, USGS, BLC, BRD, CBB, EUA, FCC, IQA, MEA, OTT, RES, SNK, STJ, VIC, YKC, HAD, HER, KAK |
| type | The type of data to download | variation, adjusted, quasi-definitive, definitivevariation, adjusted (default), quasi-definitive, definitive |
| elements | Components or elements of the geomagnetic data to download, should be a list | D, DIST, DST, E, E-E, E-N, F, G, H, SQ, SV, UK1, UK2, UK3, UK4, X, Y, ZD, DIST, DST, E, E-E, E-N, F, G, H, SQ, SV, UK1, UK2, UK3, UK4, X, Y, Z |
| sampling_period | Sampling period of data to download in seconds | 1, 60, 3600 |
| start | Start time (YYYY-MM-DDThh:mm:ss) in UTC time | |
| end | End time (YYYY-MM-DDThh:mm:ss) in UTC time |
request_df = pd.DataFrame(
    {
        "observatory": ["frn", "frn", "ott", "ott"],
        "type": ["adjusted"] * 4,
        "elements": [["x", "y"]] * 4,
        "sampling_period": [1] * 4,
        "start": [
            "2022-01-01T00:00:00",
            "2022-01-03T00:00:00",
            "2022-01-01T00:00:00",
            "2022-01-03T00:00:00",
        ],
        "end": [
            "2022-01-02T00:00:00",
            "2022-01-04T00:00:00",
            "2022-01-02T00:00:00",
            "2022-01-04T00:00:00",
        ],
    }
)request_dfAdding Run ID
When the request is input automatically run names will be assigned to different windows of time by f"sp{sampling_period}_{count:03}". So the first run is sp1_001, alternatively you can add a run column and name them as you like.
Create MTH5
Once the request is complete get the data. The file name will be created automatically as usgs_geomag_{list of observatories}_{list of elements}.h5.
Note: If the key word interact is set to True then the MTH5 stays open and the returned object is the opened MTH5 file object. If interact is set to False then the MTH5 is closed and the returned object is the path to the created file.
mth5_object = MakeMTH5.from_usgs_geomag(request_df, mth5_version="0.2.0", interact=True)2023-03-23 15:44:34,903 [line 674] mth5.mth5.MTH5._initialize_file - INFO: Initialized MTH5 0.2.0 file C:\Users\jpeacock\OneDrive - DOI\Documents\GitHub\mth5\docs\examples\notebooks\usgs_geomag_frn_ott_xy.h5 in mode a
2023-03-23 15:44:43,406 [line 311] mth5.groups.base.MasterStation.add_station - INFO: Station Fresno already exists, returning existing group.
2023-03-23 15:44:48,843 [line 311] mth5.groups.base.MasterStation.add_station - INFO: Station Ottowa already exists, returning existing group.
Check to make sure everything was downloaded properly
mth5_object.channel_summary.summarize()
mth5_object.channel_summary.to_dataframe()Have a look at a run
run = mth5_object.get_run("Fresno", "sp1_001", "USGS-GEOMAG")run_ts = run.to_runts()
run_ts.plot()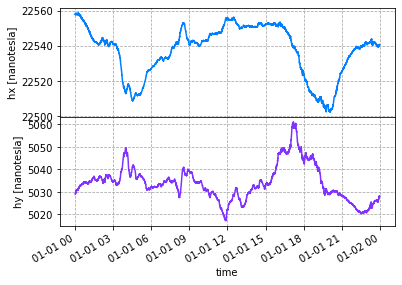
Close the MTH5 file
IMPORTANT: Be sure to close the file, otherwise bad things can happen.
mth5_object.close_mth5()2023-03-23 15:48:55,374 [line 755] mth5.mth5.MTH5.close_mth5 - INFO: Flushing and closing C:\Users\jpeacock\OneDrive - DOI\Documents\GitHub\mth5\docs\examples\notebooks\usgs_geomag_frn_ott_xy.h5