Phase Tensor Ellipses
A useful excersize is to plot phase tensors in map view along with induction vectors. These can provide yoiu with a wealth of information about dimensionality, possible conductive and resistive structures, and lateral boundaries. One note of caution with looking at phase tensors at a given period is that they are not representative of the same depth. As we saw in example 05 the depth of investigation varies between modes.
from pathlib import Path
from mtpy import MTCollection
%matplotlib inline
2022-10-19 10:32:03,779 [line 135] mth5.setup_logger - INFO: Logging file can be found C:\Users\jpeacock\OneDrive - DOI\Documents\GitHub\mth5\logs\mth5_debug.log
Open MTCollection
In the previous example we created a MTH5 file from existing Yellowstone data. Let’s open that file here for plotting.
mc = MTCollection()
mc.open_collection(Path().cwd().parent.parent.joinpath("data", "transfer_functions", "yellowstone_mt_collection_02.h5"))
Load TF List Using Bounding Box
Lets reduce our station coverage to a bounding box mainly around Yellowstone.
mc.apply_bbox(*[-112, -109.5, 44, 45.75])%%time
mt_data = mc.to_mt_data()Wall time: 39.4 s
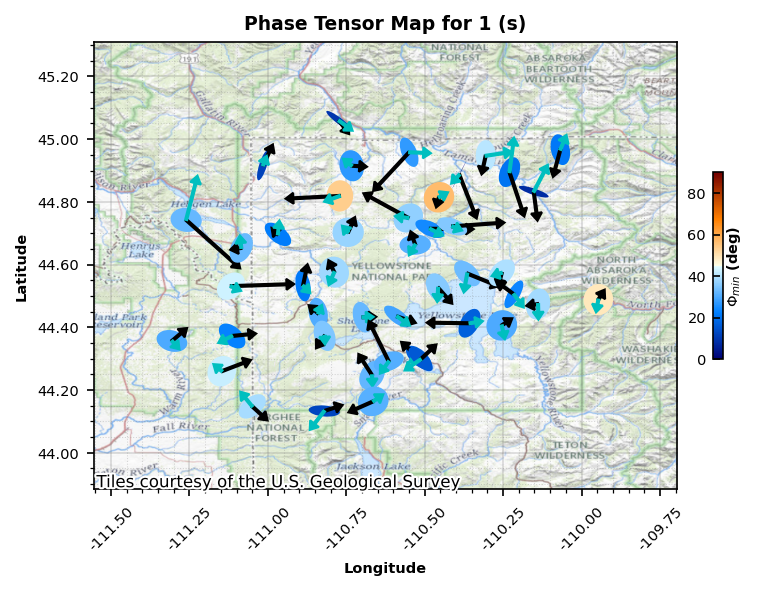
Plot Phase Tensor Maps
Here we will plot the phase tensor ellipses and induction vectors in map view. By default the USGS topo map will be set as the background, but like plotting stations we can change the background. Or if you have some geophysical data in a GeoTIFF that can be used as the background image as well.
plot_pt_map = mt_data.plot_phase_tensor_map(
    plot_tipper="yri",
    ellipse_size=0.1,
    arrow_size=0.2,
    arrow_head_width=0.035,
    arrow_head_length=0.025,
    arrow_lw=0.0065,
    x_pad=0.25,
    y_pad=0.25,
    plot_period=1,
)
2022-10-19T10:34:50 [line 140] rasterio._env.open - INFO: GDAL signalled an error: err_no=4, msg="`/vsimem/aab6ebe6-6401-4801-a88e-3d673606d5c0/aab6ebe6-6401-4801-a88e-3d673606d5c0.tif' not recognized as a supported file format."
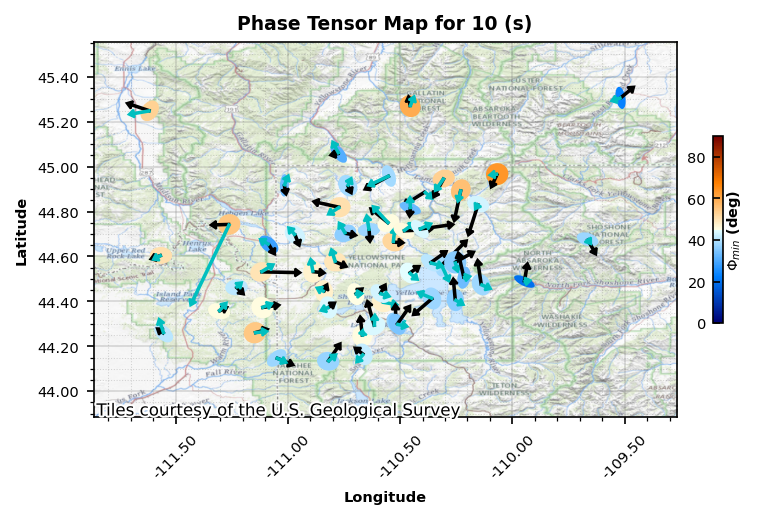
Plot Period: 10 seconds
plot_pt_map.plot_period = 10
plot_pt_map.fig_num = 2
plot_pt_map.redraw_plot()
2022-10-19T10:35:05 [line 140] rasterio._env.open - INFO: GDAL signalled an error: err_no=4, msg="`/vsimem/c5cfc150-c390-4fc6-b054-d09f1b79b74c/c5cfc150-c390-4fc6-b054-d09f1b79b74c.tif' not recognized as a supported file format."
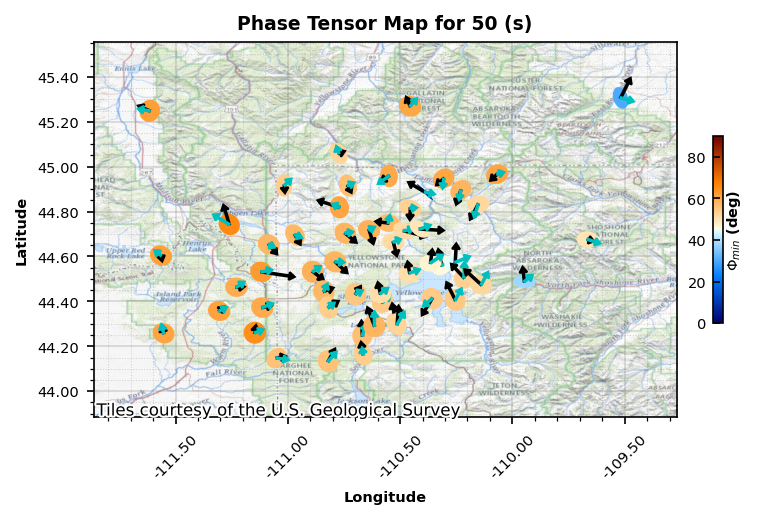
Plot Period: 50 seconds
plot_pt_map.plot_period = 50
plot_pt_map.fig_num = 3
plot_pt_map.redraw_plot()
2022-10-19T10:35:09 [line 140] rasterio._env.open - INFO: GDAL signalled an error: err_no=4, msg="`/vsimem/729bc9d0-be15-47c8-9d60-dfd0c1e800bd/729bc9d0-be15-47c8-9d60-dfd0c1e800bd.tif' not recognized as a supported file format."
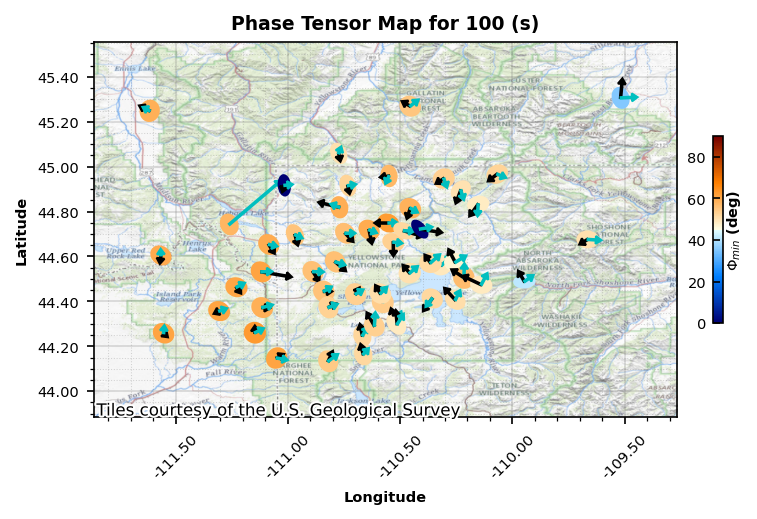
Plot Period: 100 seconds
plot_pt_map.plot_period = 100
plot_pt_map.fig_num = 4
plot_pt_map.redraw_plot()
2022-10-19T10:35:13 [line 140] rasterio._env.open - INFO: GDAL signalled an error: err_no=4, msg="`/vsimem/4d5f87ef-6243-4944-823d-4bf8354228f6/4d5f87ef-6243-4944-823d-4bf8354228f6.tif' not recognized as a supported file format."
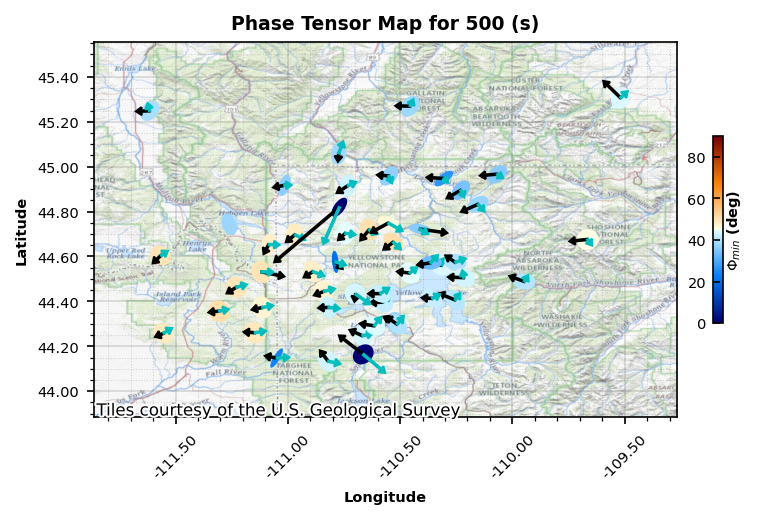
Plot Period: 500 seconds
plot_pt_map.plot_period = 500
plot_pt_map.fig_num = 5
plot_pt_map.redraw_plot()
2022-10-19T10:35:18 [line 140] rasterio._env.open - INFO: GDAL signalled an error: err_no=4, msg="`/vsimem/735cc17f-25ff-426a-9f52-0d8bb246c97b/735cc17f-25ff-426a-9f52-0d8bb246c97b.tif' not recognized as a supported file format."
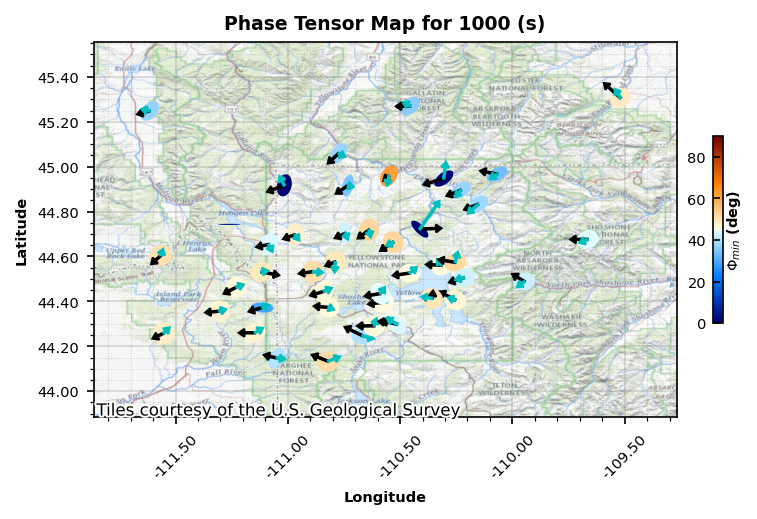
Plot Period: 1000 seconds
plot_pt_map.plot_period = 1000
plot_pt_map.fig_num = 6
plot_pt_map.redraw_plot()
2022-10-19T10:35:23 [line 140] rasterio._env.open - INFO: GDAL signalled an error: err_no=4, msg="`/vsimem/66a7a584-ee08-459f-abbe-593ee13295fc/66a7a584-ee08-459f-abbe-593ee13295fc.tif' not recognized as a supported file format."
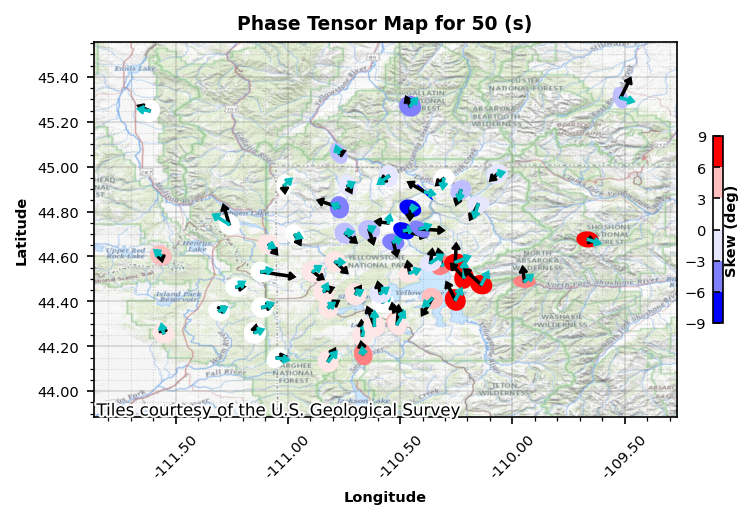
Plot Skew: 50 seconds
plot_pt_map.ellipse_colorby = "skew"
plot_pt_map.ellipse_range = (-9, 9, 3)
plot_pt_map.ellipse_cmap = "mt_seg_bl2wh2rd"
plot_pt_map.plot_period = 50
plot_pt_map.fig_num = 10
plot_pt_map.redraw_plot()
2022-10-19T10:35:26 [line 140] rasterio._env.open - INFO: GDAL signalled an error: err_no=4, msg="`/vsimem/dc0c8eb1-d96d-4763-8bd3-d83303aba879/dc0c8eb1-d96d-4763-8bd3-d83303aba879.tif' not recognized as a supported file format."
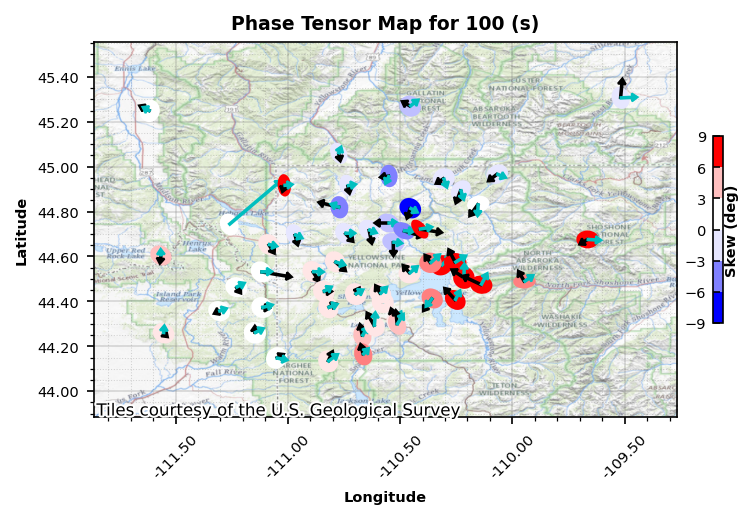
Plot Skew: 100 seconds
plot_pt_map.plot_period = 100
plot_pt_map.fig_num = 11
plot_pt_map.redraw_plot()
2022-10-19T10:35:30 [line 140] rasterio._env.open - INFO: GDAL signalled an error: err_no=4, msg="`/vsimem/ab38c714-9625-41ca-a4fc-66facce83e3d/ab38c714-9625-41ca-a4fc-66facce83e3d.tif' not recognized as a supported file format."
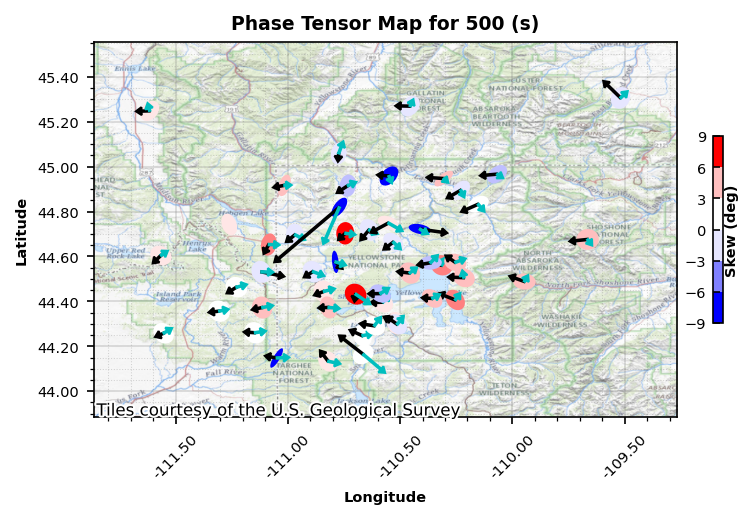
Plot Skew: 500 seconds
plot_pt_map.plot_period = 500
plot_pt_map.fig_num = 12
plot_pt_map.redraw_plot()
2022-10-19T10:35:34 [line 140] rasterio._env.open - INFO: GDAL signalled an error: err_no=4, msg="`/vsimem/b8dcf7df-489d-4458-ab3f-66f04dee37e9/b8dcf7df-489d-4458-ab3f-66f04dee37e9.tif' not recognized as a supported file format."
All Data Plot Period: 5000 seconds
Use all data now
%%time
mc.working_dataframe = None
mt_data = mc.to_mt_data()
Wall time: 3min 3s
plot_pt_map_all = mt_data.plot_phase_tensor_map(
plot_tipper="yri",
ellipse_size=0.4,
arrow_size=0.6,
arrow_head_width=0.035,
arrow_head_length=0.025,
arrow_lw=0.0065,
x_pad=0.75,
y_pad=0.75,
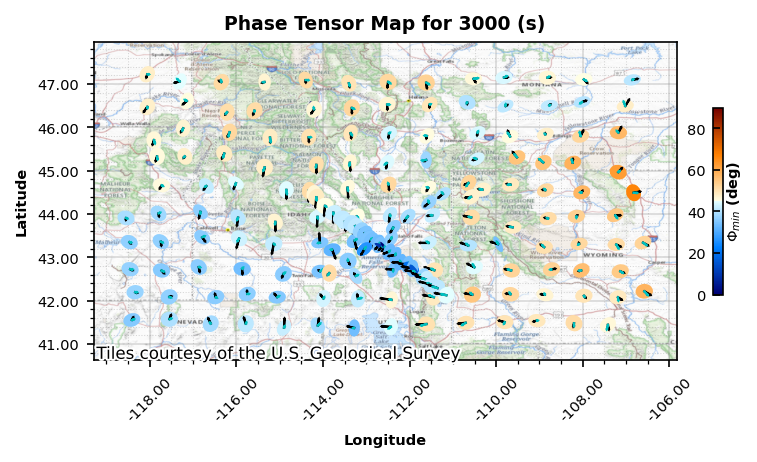
plot_period=3000,
fig_num=7,
)2022-10-19T10:41:11 [line 140] rasterio._env.open - INFO: GDAL signalled an error: err_no=4, msg="`/vsimem/0884b97c-a9eb-4a03-b8a5-b1a370e46f47/0884b97c-a9eb-4a03-b8a5-b1a370e46f47.tif' not recognized as a supported file format."
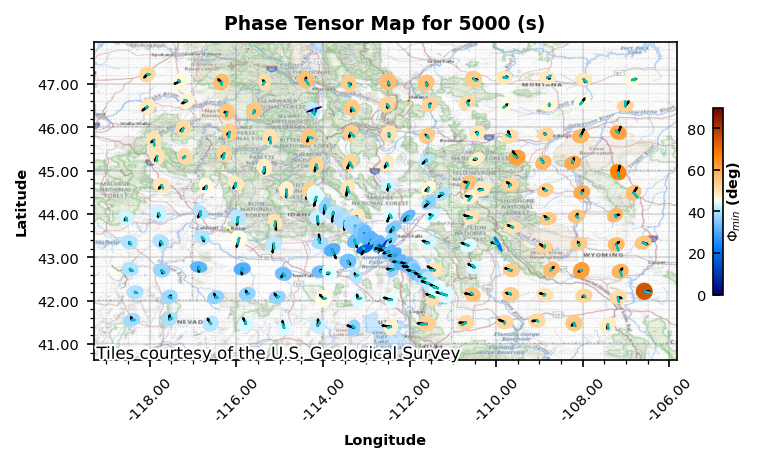
Plot Period: 5000 seconds
plot_pt_map_all.plot_period = 5000
plot_pt_map_all.fig_num = 8
plot_pt_map_all.redraw_plot()
2022-10-19T10:41:18 [line 140] rasterio._env.open - INFO: GDAL signalled an error: err_no=4, msg="`/vsimem/a027b789-5f27-4d95-b997-2dc0d0fd723f/a027b789-5f27-4d95-b997-2dc0d0fd723f.tif' not recognized as a supported file format."
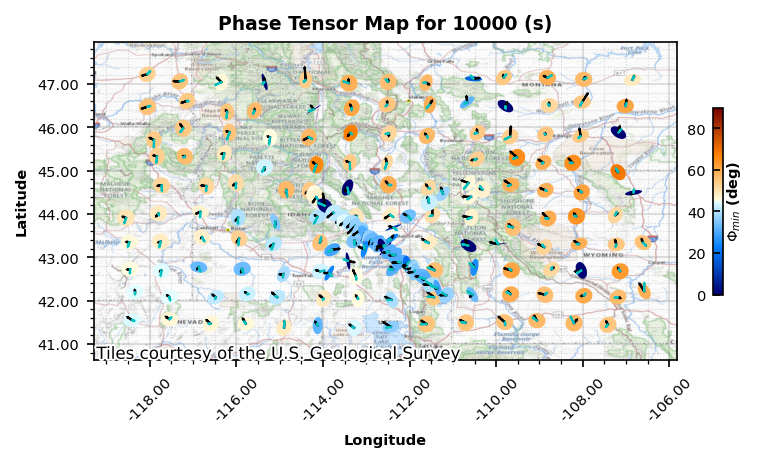
All Data Plot Period: 10000 seconds
plot_pt_map_all.plot_period = 10000
plot_pt_map_all.fig_num = 9
plot_pt_map_all.redraw_plot()
2022-10-19T10:41:23 [line 140] rasterio._env.open - INFO: GDAL signalled an error: err_no=4, msg="`/vsimem/6a97103f-a12a-4598-bb81-82c7cc7bdf2c/6a97103f-a12a-4598-bb81-82c7cc7bdf2c.tif' not recognized as a supported file format."
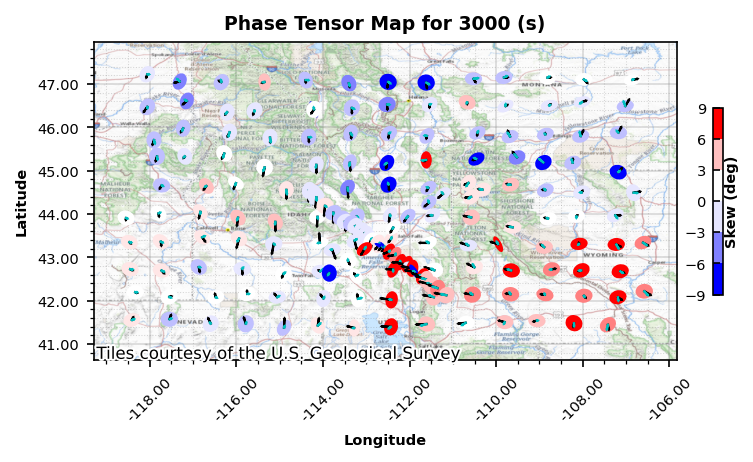
Plot Skew All: 3000 seconds
plot_pt_map_all.ellipse_colorby = "skew"
plot_pt_map_all.ellipse_range = (-9, 9, 3)
plot_pt_map_all.ellipse_cmap = "mt_seg_bl2wh2rd"
plot_pt_map_all.plot_period = 3000
plot_pt_map_all.fig_num = 15
plot_pt_map_all.redraw_plot()
2022-10-19T10:41:28 [line 140] rasterio._env.open - INFO: GDAL signalled an error: err_no=4, msg="`/vsimem/b0c8f2ba-f57f-4356-9e24-05048851bc35/b0c8f2ba-f57f-4356-9e24-05048851bc35.tif' not recognized as a supported file format."
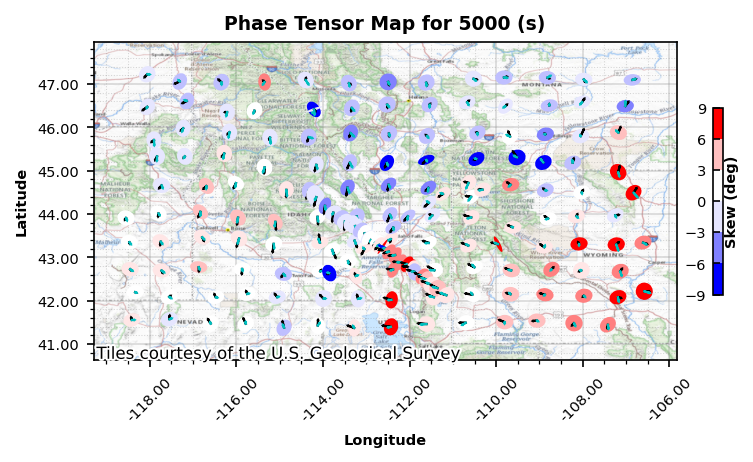
Plot Skew All: 5000 seconds
plot_pt_map_all.plot_period = 5000
plot_pt_map_all.fig_num = 16
plot_pt_map_all.redraw_plot()
2022-10-19T10:41:34 [line 140] rasterio._env.open - INFO: GDAL signalled an error: err_no=4, msg="`/vsimem/df98b071-f4cb-498a-a016-e893ca536794/df98b071-f4cb-498a-a016-e893ca536794.tif' not recognized as a supported file format."
Plot Skew All: 10000 seconds
plot_pt_map_all.plot_period = 10000
plot_pt_map_all.fig_num = 17
plot_pt_map_all.redraw_plot()Close MTCollection
mc.close_collection()2022-10-19 11:55:51,952 [line 325] mth5.mth5.MTH5.filename - WARNING: MTH5 file is not open or has not been created yet. Returning default name
2022-10-19 11:55:51,958 [line 753] mth5.mth5.MTH5.close_mth5 - INFO: Flushing and closing C:\Users\jpeacock\OneDrive - DOI\Documents\GitHub\iris-mt-course-2022\data\transfer_functions\yellowstone_mt_collection_02.h5
2022-10-19 11:55:52,148 [line 124] mth5.helpers.close_open_files - INFO: Object <class 'h5py._hl.files.File'> does not have __class__
2022-10-19 11:55:52,186 [line 119] mth5.helpers.close_open_files - INFO: C:\Users\jpeacock\OneDrive - DOI\Documents\GitHub\iris-mt-course-2022\data\transfer_functions\yellowstone_mt_collection.h5, Closed File