Resistivity and Phase maps
Plotting apparent resistivity and phase maps can be helpful.
from pathlib import Path
from mtpy import MTCollection
%matplotlib inline
Open MTCollection
In the previous example we created a MTH5 file from existing Yellowstone data. Let’s open that file here for plotting.
%%time
with MTCollection() as mc:
    mc.open_collection(Path().cwd().joinpath("yellowstone_mt_collection.h5"))
    mt_data = mc.to_mt_data()
24:10:17T16:09:13 | INFO | line:777 |mth5.mth5 | close_mth5 | Flushing and closing /home/jovyan/earthscope-mt-course/notebooks/mtpy/yellowstone_mt_collection.h5
CPU times: user 1min 15s, sys: 799 ms, total: 1min 16s
Wall time: 1min 17s
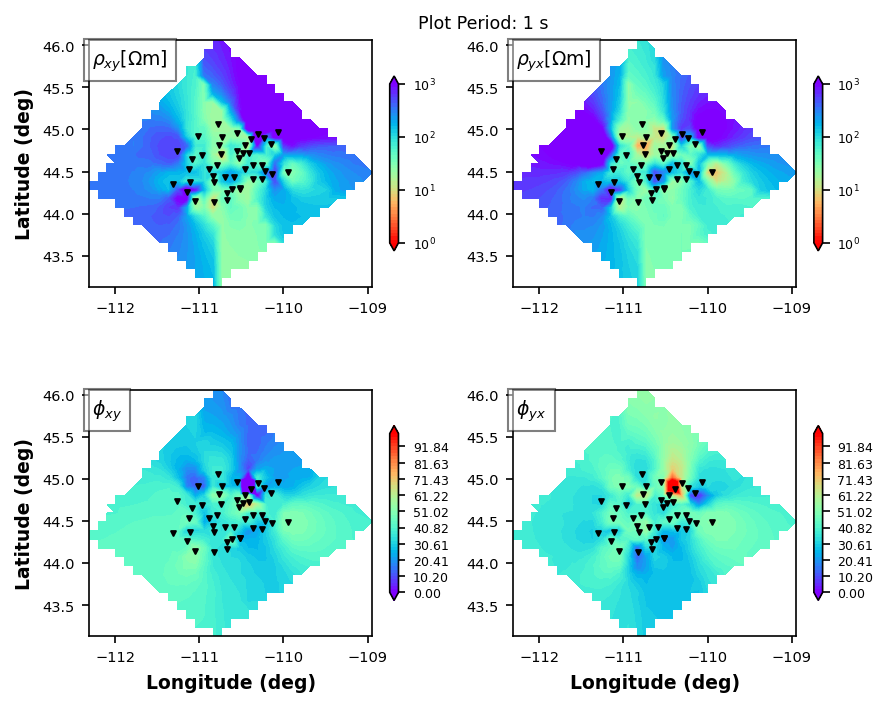
Plot Apparent Resitivity and Phase Maps
We can plot the apparent resistivity and phase of all components, or just a few for a given period. Again, first get the tf_list from the MTCollection it takes about 1 second per stations, so can take a while for large surveys.
plot_rp_maps = mt_data.plot_resistivity_phase_maps(
    fig_num=1,
    interpolation_method = "delaunay",
    cell_size = .1,
    marker_size=5
)
Fetching long content....
plot_rp_maps.plot_period = 10
plot_rp_maps.fig_num = 3
plot_rp_maps.redraw_plot()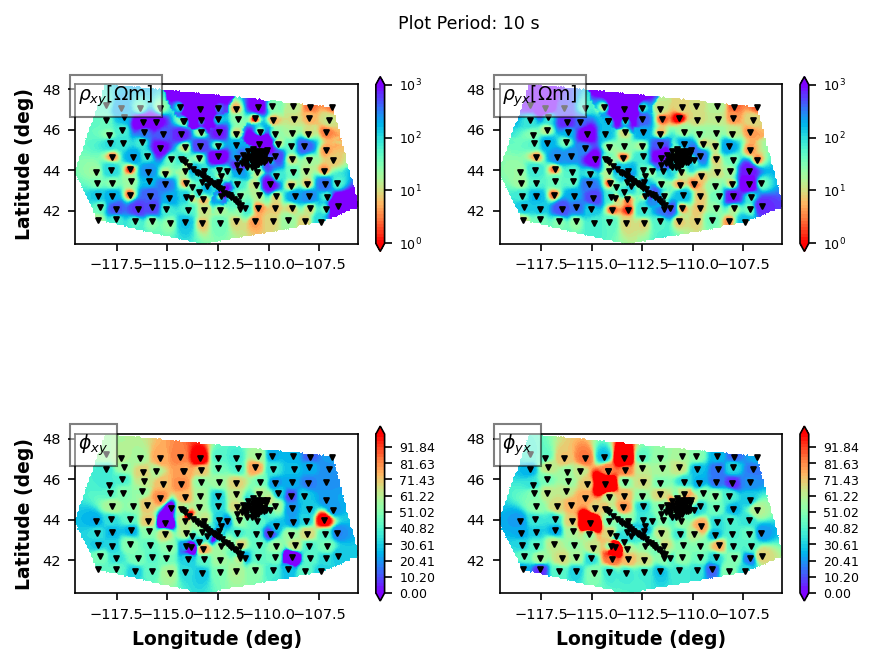
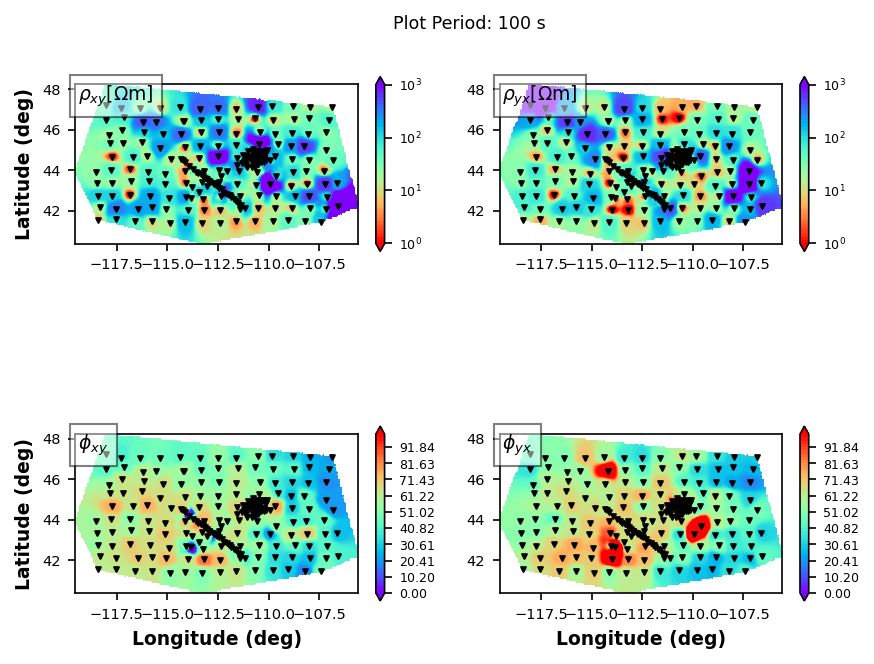
plot_rp_maps.plot_period = 100
plot_rp_maps.fig_num = 4
plot_rp_maps.redraw_plot()
24:10:17T16:13:14 | WARNING | line:259 |mtpy.imaging.plot_resphase_maps | _get_data_array | Could not interpolate period 100 for station YNP15S
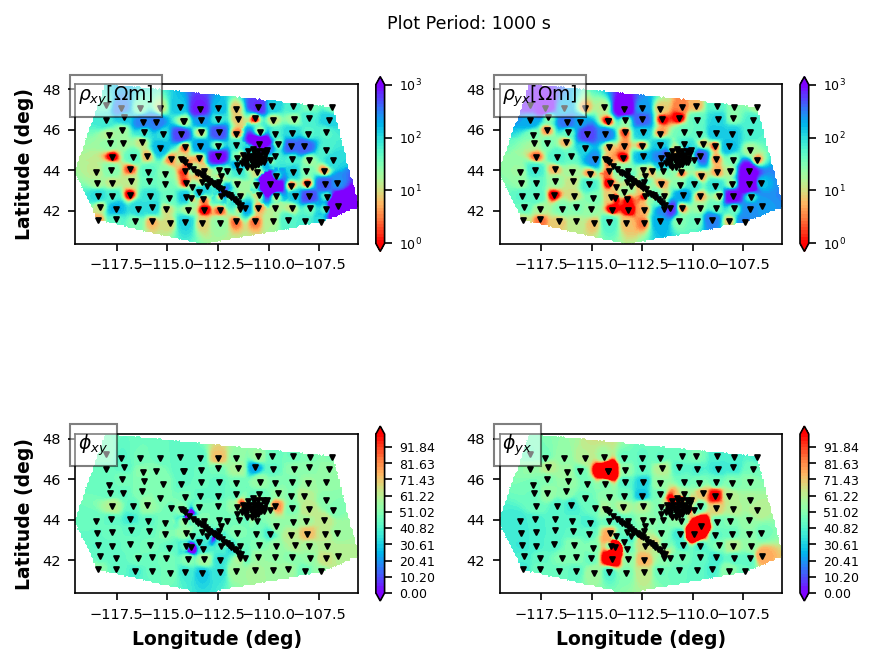
plot_rp_maps.plot_period = 1000
plot_rp_maps.fig_num = 5
plot_rp_maps.redraw_plot()
24:10:17T16:13:22 | WARNING | line:259 |mtpy.imaging.plot_resphase_maps | _get_data_array | Could not interpolate period 1000 for station YNP06S
24:10:17T16:13:23 | WARNING | line:259 |mtpy.imaging.plot_resphase_maps | _get_data_array | Could not interpolate period 1000 for station YNP14S
24:10:17T16:13:23 | WARNING | line:259 |mtpy.imaging.plot_resphase_maps | _get_data_array | Could not interpolate period 1000 for station YNP15S
24:10:17T16:13:23 | WARNING | line:259 |mtpy.imaging.plot_resphase_maps | _get_data_array | Could not interpolate period 1000 for station YNP23S
24:10:17T16:13:23 | WARNING | line:259 |mtpy.imaging.plot_resphase_maps | _get_data_array | Could not interpolate period 1000 for station YNP25S
24:10:17T16:13:23 | WARNING | line:259 |mtpy.imaging.plot_resphase_maps | _get_data_array | Could not interpolate period 1000 for station YNP30S
24:10:17T16:13:23 | WARNING | line:259 |mtpy.imaging.plot_resphase_maps | _get_data_array | Could not interpolate period 1000 for station YNP33B
24:10:17T16:13:23 | WARNING | line:259 |mtpy.imaging.plot_resphase_maps | _get_data_array | Could not interpolate period 1000 for station YNP43S
24:10:17T16:13:23 | WARNING | line:259 |mtpy.imaging.plot_resphase_maps | _get_data_array | Could not interpolate period 1000 for station YNP46S
plot_rp_maps.plot_period = 5000
plot_rp_maps.fig_num = 6
plot_rp_maps.redraw_plot()
Loading...
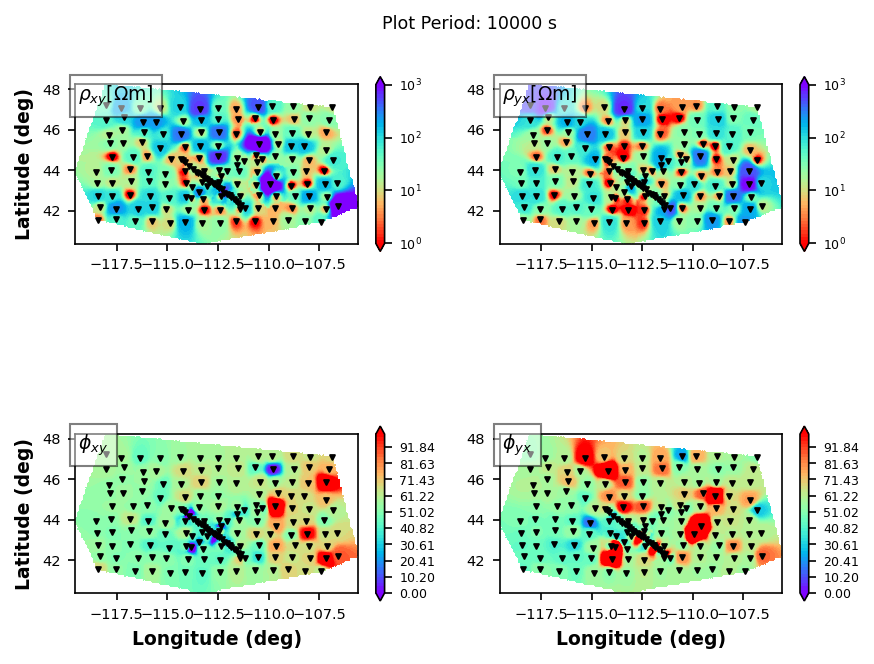
plot_rp_maps.plot_period = 10000
plot_rp_maps.fig_num = 7
plot_rp_maps.redraw_plot()
24:10:17T16:13:35 | WARNING | line:259 |mtpy.imaging.plot_resphase_maps | _get_data_array | Could not interpolate period 10000 for station MTE13
24:10:17T16:13:35 | WARNING | line:259 |mtpy.imaging.plot_resphase_maps | _get_data_array | Could not interpolate period 10000 for station MTG16
24:10:17T16:13:35 | WARNING | line:259 |mtpy.imaging.plot_resphase_maps | _get_data_array | Could not interpolate period 10000 for station YNP01S
24:10:17T16:13:35 | WARNING | line:259 |mtpy.imaging.plot_resphase_maps | _get_data_array | Could not interpolate period 10000 for station YNP02S
24:10:17T16:13:35 | WARNING | line:259 |mtpy.imaging.plot_resphase_maps | _get_data_array | Could not interpolate period 10000 for station YNP03B
24:10:17T16:13:35 | WARNING | line:259 |mtpy.imaging.plot_resphase_maps | _get_data_array | Could not interpolate period 10000 for station YNP04B
24:10:17T16:13:35 | WARNING | line:259 |mtpy.imaging.plot_resphase_maps | _get_data_array | Could not interpolate period 10000 for station YNP05S
24:10:17T16:13:35 | WARNING | line:259 |mtpy.imaging.plot_resphase_maps | _get_data_array | Could not interpolate period 10000 for station YNP06S
24:10:17T16:13:35 | WARNING | line:259 |mtpy.imaging.plot_resphase_maps | _get_data_array | Could not interpolate period 10000 for station YNP07B
24:10:17T16:13:35 | WARNING | line:259 |mtpy.imaging.plot_resphase_maps | _get_data_array | Could not interpolate period 10000 for station YNP08S
24:10:17T16:13:35 | WARNING | line:259 |mtpy.imaging.plot_resphase_maps | _get_data_array | Could not interpolate period 10000 for station YNP09S
24:10:17T16:13:35 | WARNING | line:259 |mtpy.imaging.plot_resphase_maps | _get_data_array | Could not interpolate period 10000 for station YNP10S
24:10:17T16:13:35 | WARNING | line:259 |mtpy.imaging.plot_resphase_maps | _get_data_array | Could not interpolate period 10000 for station YNP11S
24:10:17T16:13:35 | WARNING | line:259 |mtpy.imaging.plot_resphase_maps | _get_data_array | Could not interpolate period 10000 for station YNP13B
24:10:17T16:13:35 | WARNING | line:259 |mtpy.imaging.plot_resphase_maps | _get_data_array | Could not interpolate period 10000 for station YNP14S
24:10:17T16:13:35 | WARNING | line:259 |mtpy.imaging.plot_resphase_maps | _get_data_array | Could not interpolate period 10000 for station YNP15S
24:10:17T16:13:35 | WARNING | line:259 |mtpy.imaging.plot_resphase_maps | _get_data_array | Could not interpolate period 10000 for station YNP16S
24:10:17T16:13:35 | WARNING | line:259 |mtpy.imaging.plot_resphase_maps | _get_data_array | Could not interpolate period 10000 for station YNP18B
24:10:17T16:13:35 | WARNING | line:259 |mtpy.imaging.plot_resphase_maps | _get_data_array | Could not interpolate period 10000 for station YNP19B
24:10:17T16:13:35 | WARNING | line:259 |mtpy.imaging.plot_resphase_maps | _get_data_array | Could not interpolate period 10000 for station YNP20B
24:10:17T16:13:35 | WARNING | line:259 |mtpy.imaging.plot_resphase_maps | _get_data_array | Could not interpolate period 10000 for station YNP21S
24:10:17T16:13:35 | WARNING | line:259 |mtpy.imaging.plot_resphase_maps | _get_data_array | Could not interpolate period 10000 for station YNP22S
24:10:17T16:13:35 | WARNING | line:259 |mtpy.imaging.plot_resphase_maps | _get_data_array | Could not interpolate period 10000 for station YNP23S
24:10:17T16:13:35 | WARNING | line:259 |mtpy.imaging.plot_resphase_maps | _get_data_array | Could not interpolate period 10000 for station YNP24S
24:10:17T16:13:35 | WARNING | line:259 |mtpy.imaging.plot_resphase_maps | _get_data_array | Could not interpolate period 10000 for station YNP25S
24:10:17T16:13:35 | WARNING | line:259 |mtpy.imaging.plot_resphase_maps | _get_data_array | Could not interpolate period 10000 for station YNP26aB
24:10:17T16:13:35 | WARNING | line:259 |mtpy.imaging.plot_resphase_maps | _get_data_array | Could not interpolate period 10000 for station YNP27B
24:10:17T16:13:35 | WARNING | line:259 |mtpy.imaging.plot_resphase_maps | _get_data_array | Could not interpolate period 10000 for station YNP28S
24:10:17T16:13:35 | WARNING | line:259 |mtpy.imaging.plot_resphase_maps | _get_data_array | Could not interpolate period 10000 for station YNP29S
24:10:17T16:13:35 | WARNING | line:259 |mtpy.imaging.plot_resphase_maps | _get_data_array | Could not interpolate period 10000 for station YNP30S
24:10:17T16:13:35 | WARNING | line:259 |mtpy.imaging.plot_resphase_maps | _get_data_array | Could not interpolate period 10000 for station YNP31B
24:10:17T16:13:35 | WARNING | line:259 |mtpy.imaging.plot_resphase_maps | _get_data_array | Could not interpolate period 10000 for station YNP32S
24:10:17T16:13:35 | WARNING | line:259 |mtpy.imaging.plot_resphase_maps | _get_data_array | Could not interpolate period 10000 for station YNP33B
24:10:17T16:13:35 | WARNING | line:259 |mtpy.imaging.plot_resphase_maps | _get_data_array | Could not interpolate period 10000 for station YNP34S
24:10:17T16:13:35 | WARNING | line:259 |mtpy.imaging.plot_resphase_maps | _get_data_array | Could not interpolate period 10000 for station YNP35S
24:10:17T16:13:35 | WARNING | line:259 |mtpy.imaging.plot_resphase_maps | _get_data_array | Could not interpolate period 10000 for station YNP36S
24:10:17T16:13:35 | WARNING | line:259 |mtpy.imaging.plot_resphase_maps | _get_data_array | Could not interpolate period 10000 for station YNP37S
24:10:17T16:13:35 | WARNING | line:259 |mtpy.imaging.plot_resphase_maps | _get_data_array | Could not interpolate period 10000 for station YNP38B
24:10:17T16:13:35 | WARNING | line:259 |mtpy.imaging.plot_resphase_maps | _get_data_array | Could not interpolate period 10000 for station YNP40B
24:10:17T16:13:35 | WARNING | line:259 |mtpy.imaging.plot_resphase_maps | _get_data_array | Could not interpolate period 10000 for station YNP43S
24:10:17T16:13:35 | WARNING | line:259 |mtpy.imaging.plot_resphase_maps | _get_data_array | Could not interpolate period 10000 for station YNP44S
24:10:17T16:13:35 | WARNING | line:259 |mtpy.imaging.plot_resphase_maps | _get_data_array | Could not interpolate period 10000 for station YNP45S
24:10:17T16:13:35 | WARNING | line:259 |mtpy.imaging.plot_resphase_maps | _get_data_array | Could not interpolate period 10000 for station YNP46S
24:10:17T16:13:35 | WARNING | line:259 |mtpy.imaging.plot_resphase_maps | _get_data_array | Could not interpolate period 10000 for station YNP47B
24:10:17T16:13:35 | WARNING | line:259 |mtpy.imaging.plot_resphase_maps | _get_data_array | Could not interpolate period 10000 for station YNP50S
24:10:17T16:13:35 | WARNING | line:259 |mtpy.imaging.plot_resphase_maps | _get_data_array | Could not interpolate period 10000 for station YNPXLS
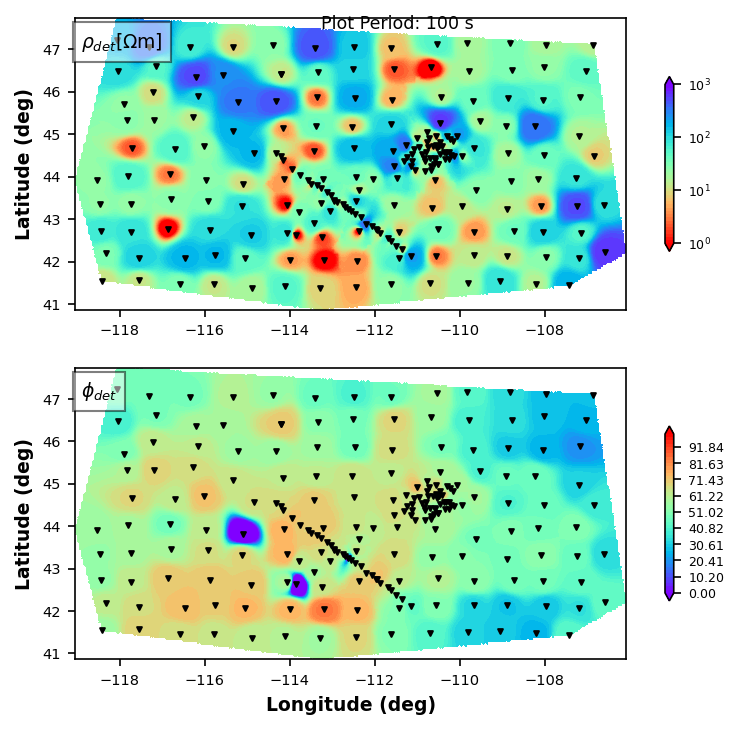
Plot Determinant
Often plotting the determinant is a good proxy for 3D models.
plot_rp_maps.plot_period = 100
plot_rp_maps.fig_num = 8
plot_rp_maps.plot_det = True
plot_rp_maps.plot_xy = False
plot_rp_maps.plot_yx = False
plot_rp_maps.cell_size = .05
plot_rp_maps.redraw_plot()
24:10:17T16:13:48 | WARNING | line:259 |mtpy.imaging.plot_resphase_maps | _get_data_array | Could not interpolate period 100 for station YNP15S